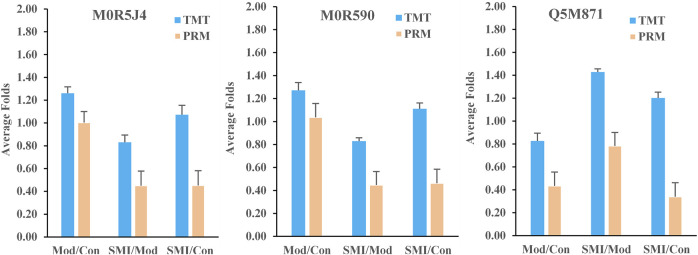
FIGURE 8.
Average protein relative expression folds of the three proteins (M0R5J4, M0R590, and Q5M871) in Mod: Con, SMI: Mod, and SMI: Con by TMT and PRM, respectively. n = 3 samples for each group (3 data points for each bar), each consisting of serum of three rats.

