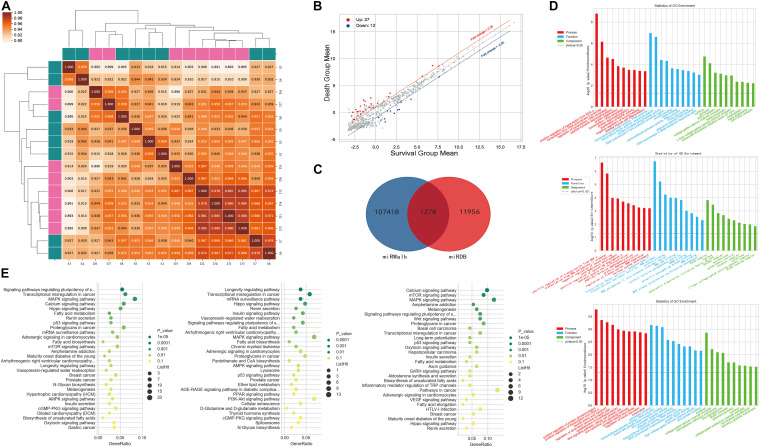
FIGURE 2.
Differential expression of PBMC miRNAs between death and survival groups in the discovery cohort. (A) The correlation coefficient graph shows the similarity of the expression patterns of the samples in the group. (B) The scatter plot of DEMIRs. The red spots indicate significantly upregulated miRNAs, and the blue spots indicate significantly downregulated miRNAs. (C) The intersection of the predicted target genes of DEMIRs from two databases. (D) The gene ontology annotation for the predicted target genes of DEMIRs. The higher the bar chart height, the smaller the corresponding P-value. Red indicates biological process, blue indicates molecular function, and green indicates cellular component. (E) Pathways enrichment analysis for the predicted target genes of DEMIRs. The horizontal axis shows the enrichment degree and the vertical axis represents the enrichment pathway. The larger spots indicates that the more predicted target genes fall into the pathway and the greener the color, the higher the significance of enrichment.

