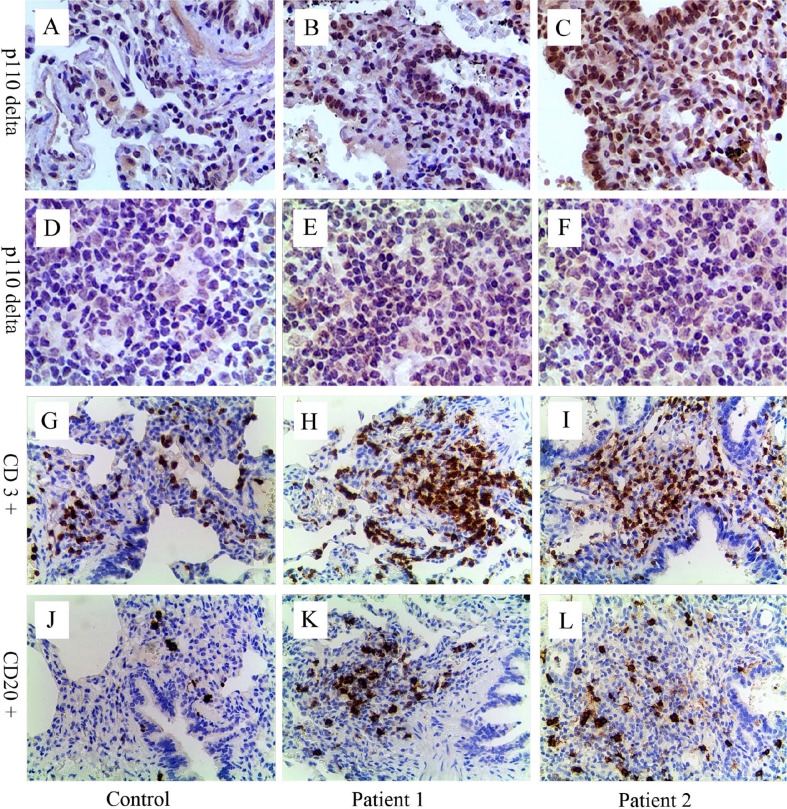
Figure 2.
Immunohistochemical analyses for p110δ, CD3, and CD20. Compared with control (A, D), expression of p110δ (brown signal) in lung tissue and lymph node sections from patient 1 (B, E) and 2 (C, F) significantly increased. Many inflammatory cells infiltrated around the airway and in the lung parenchyma (H, I, K, L). Relative to control (G, J), CD3+ T cells (H, I, brown signal) and CD20+ B cells (K, L, brown signal) significantly increased, especially CD3+ T cells. The control lung sample was from a child’s lung tumor resection, and lymph node sample was from a child with reactive lymph node hyperplasia.

