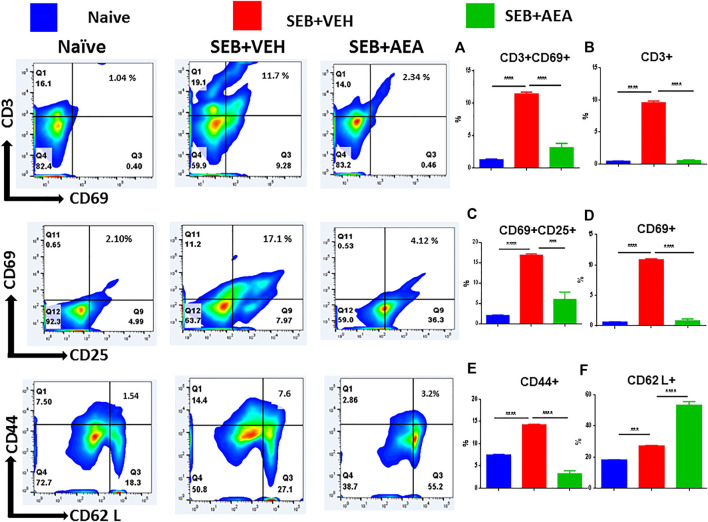
FIGURE 4.
AEA suppresses T cell activation markers in splenocytes activated with SEB. The spleen cells were pretreated with AEA and then activated with SEB in vitro for 48 h as described in Figure 3 legend. The cells were stained for various activation markers. Each panel shows a representative experiment using flow cytometry, and the vertical bars depict percentage data from groups of five mice with Mean+/-SEM. (A) CD3+CD69 + cells, (B) CD3+ cells, (C) CD69 + 25+ cells, (D) CD69 + cells, (E) CD44 + cells, (F) CD62L + cells. *p ≤ 0. 05, **p ≤ 0. 01, ***p ≤ 0. 001.

