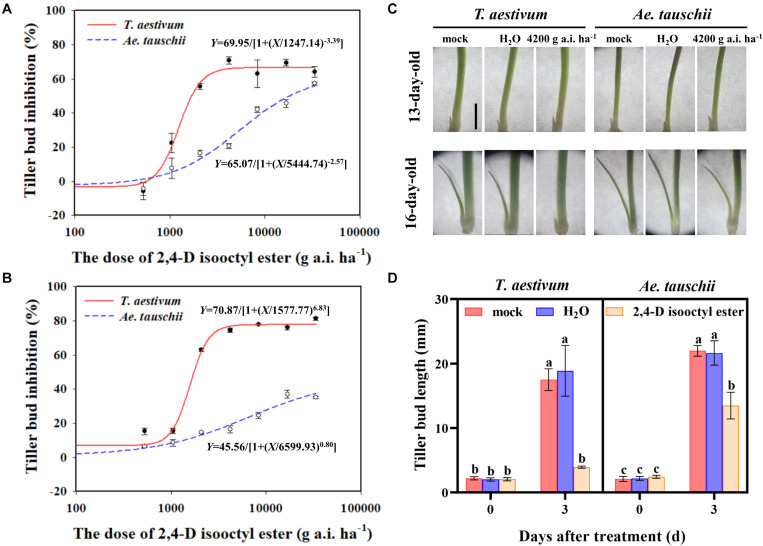
FIGURE 1.
(A,B) Dose response of Triticum aestivum and Aegilops tauschii tiller bud growth to 2,4-D isooctyl ester at 3 (A) and 6 (B) days after treatment (DAT). (C) Phenotypes of T. aestivum and Ae. tauschii tiller buds in the axil of the first leaf at 0 DAT (13-day old) and 3 DAT (16-day-old). The scale bar represents 5 mm. (D) The length of tiller buds located at the axil of the first leaf in T. aestivum and Ae. tauschii at 0 and 3 days after treatment with 4200 g a.i. ha– 1 2,4-D isooctyl ester. Error bars represent the mean ± SD (n = 3). Different letters represent significant differences (ANOVA, Student-Newman-Keuls test, P < 0.05).

