FIGURE 2.
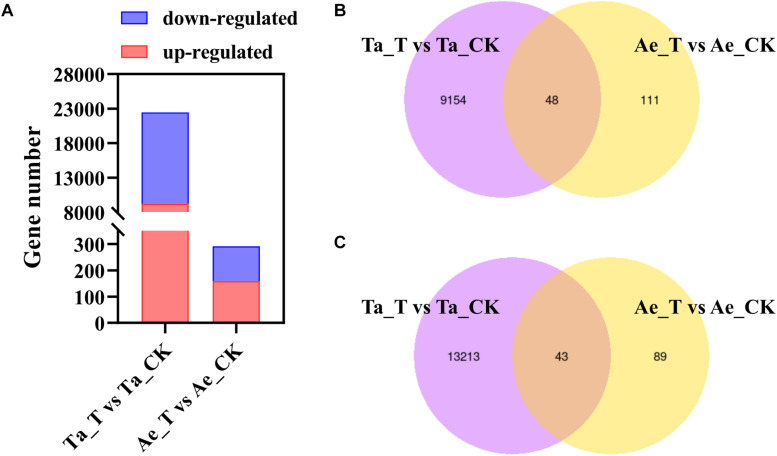
Differentially expressed genes (DEGs) in T. aestivum and Ae. tauschii response to 2,4-D isooctyl ester. (A) Numbers of upregulated DEGs and downregulated DEGs. (B,C) Venn diagram of two comparison groups of upregulated DEGs (B) and downregulated DEGs (C). Ta_T, T. aestivum with 2,4-D isooctyl ester treatment; Ta-CK, T. aestivum without 2,4-D isooctyl ester treatment; Ae_T, Ae. tauschii with 2,4-D isooctyl ester treatment; Ae-CK, Ae. tauschii without 2,4-D isooctyl ester treatment.

