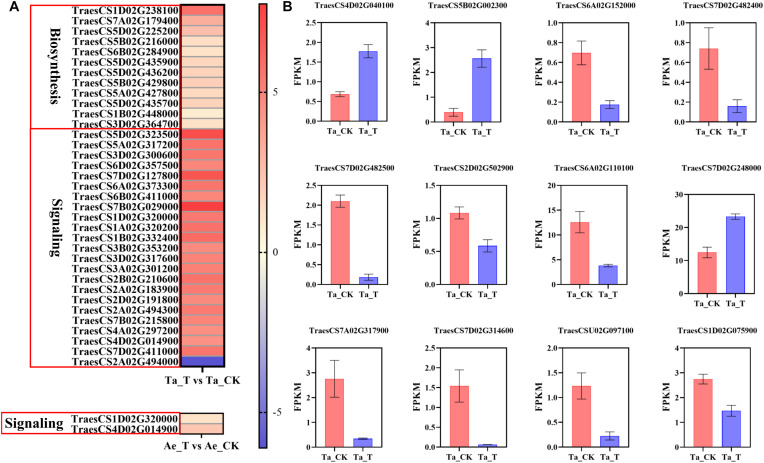
FIGURE 4.
(A) The expression level of DEGs related with auxin biosynthesis and signal transduction in T. aestivum and Ae. tauschii based on log2 (fold change) with untreated plants as control. DEGs related with auxin signal transduction in T. aestivum with | log2 (fold change)| over 4 are shown. Each row represents one gene. (B) The fragments per kilobase of exon model per million mapped reads (FPKM) values of DEGs associated with tiller bud development in T. aestivum. Error bars represent the mean ± SD (n = 3). Other abbreviations were as shown in Figure 2.

