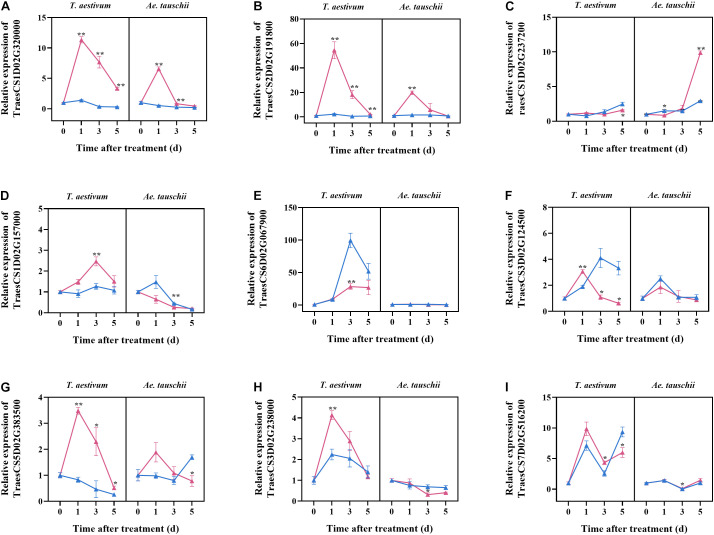
FIGURE 5.
The relative expression levels of nine candidate genes selected from transcriptome analysis. The samples were collected from tillers buds of T. aestivum and Ae. tauschii at 0, 1, 3, and 5 days after 2,4-D isooctyl ester treatment. At 0 days after treatment, the relative expression level of target genes in untreated T. aestivum and Ae. tauschii seedlings was set 1, respectively. Red line represents seedlings with 2,4-D isooctyl ester treatment (treatment); blue line represents seedlings without 2,4-D isooctyl ester treatment (mock). Error bars represent the mean ± SD (n = 3). The significant difference between mock group and treatment group is indicated (t-test, *P < 0.05, **P < 0.01). The annotations of gene ID (A–I) are as shown in Table 2.

