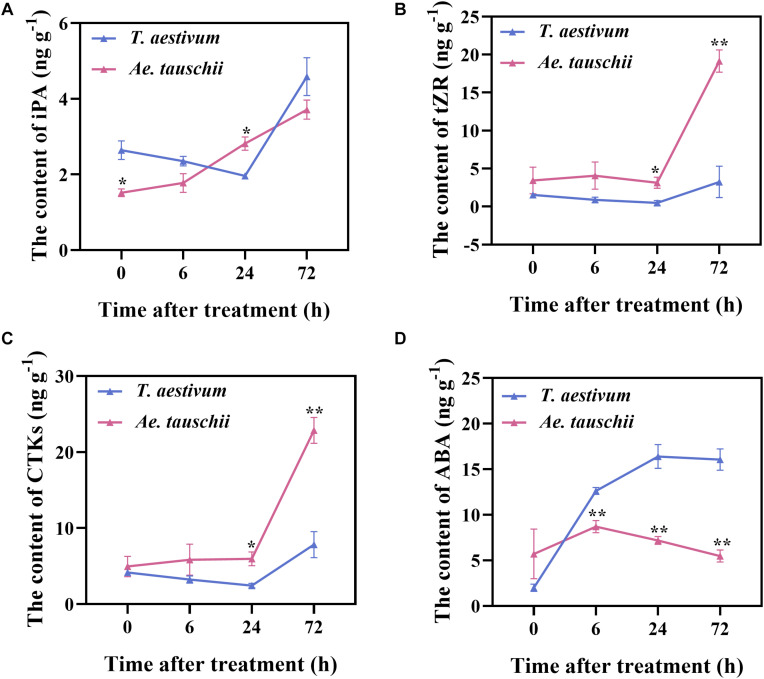
FIGURE 6.
The levels of N6-isopentenyladenosine (A), trans-zeatin-riboside (B), total cytokinin (C), and abscisic acid (D) detected in the 0.5 cm basal part of the stem in T. aestivum and Ae. tauschii at 0, 6, 24, and 72 h after 2,4-D isooctyl ester treatment. Error bars represent the mean ± SD (n = 3). The significant difference between T. aestivum and Ae. tauschii is indicated (t-test, *P < 0.05, **P < 0.01).

