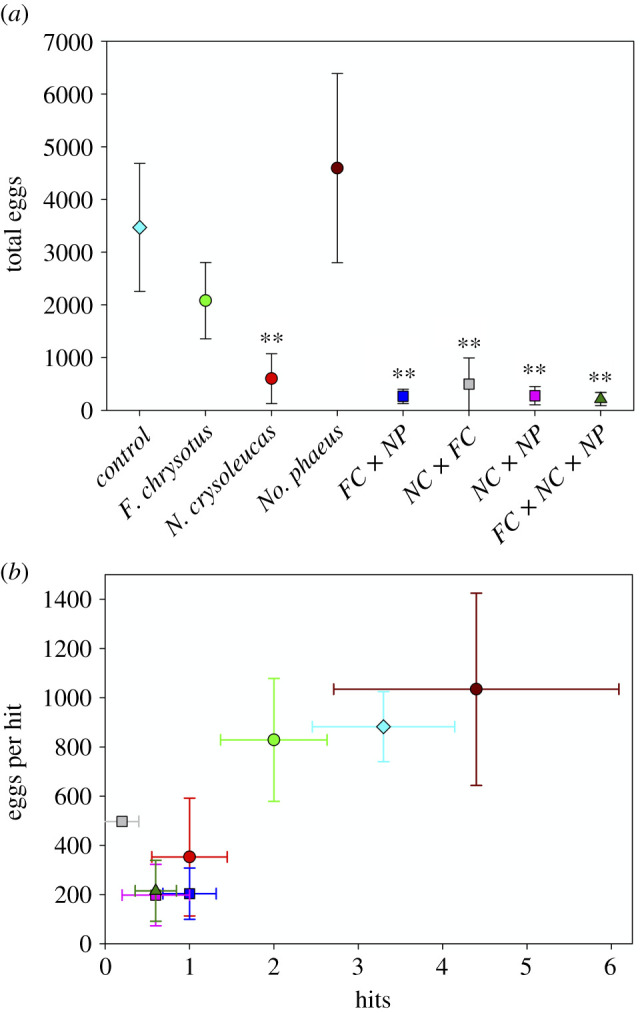
Figure 2.

(a) Results of Dunnett's procedure (with Dunnett–Hsu correction) for (a) mean total eggs ± 1 s.e., *p < 0.05, **p < 0.01. (b) Mean total oviposition events (hits) ± 1 s.e. and mean deposition ± 1 s.e., for all individual treatments (table 1 for details). All five treatments in lower left had Dunnett's p < 0.01 for both variables. Both plots show raw treatment means. (Online version in colour.)
