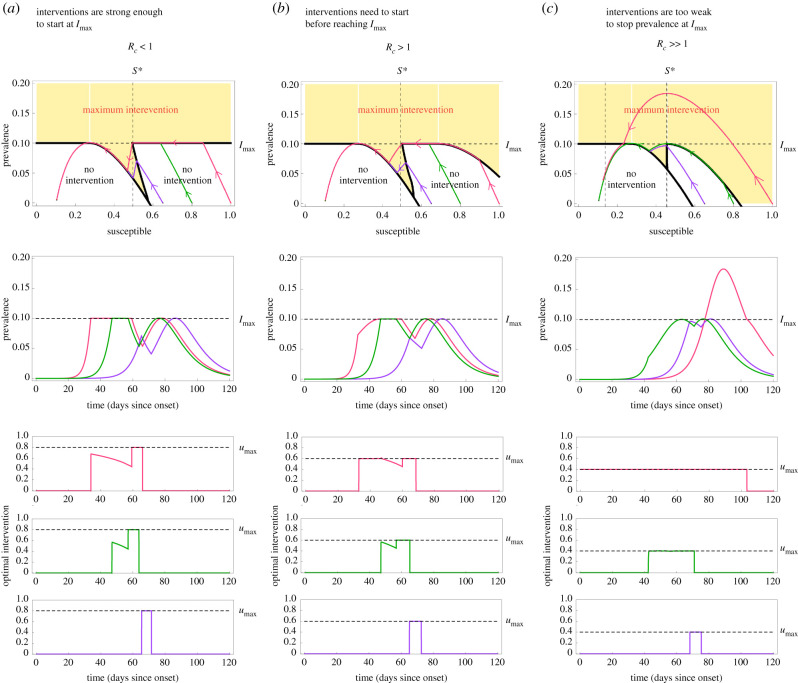
Figure 3.
Optimal non-pharmaceutical interventions in the Susceptible–Infected–Removed model. For all panels, the parameters of the SIR model are γ = 1/7, β = 0.52 (i.e. R0 = 3.64) and Imax = 0.1. We consider a population of N = 8.855 × 10⁶ individuals (like in Mexico City) and I0 = 1/N. Panels shows trajectories for three initial proportions of the susceptible population: large S0 = 1 − I0 ≈ 1 (pink), medium S0 = 0.8 (green) and small S0 = 0.65 (purple). (a) For umax = 0.8, we have Rc = (1 − umax)R0 = 0.728 ≤ 1. In this case, the optimal intervention starts when the disease prevalence reaches Imax. Afterwards, the intervention decreases in a hyperbolic arc until reaching the point S = S*. At that time, the intervention becomes maximum in the ‘final push’ to reach the safe zone. (b) For umax = 0.58, the controlled reproduction number is Rc = (1 − umax)R0 = 1.52 > 1. Here, , implying that the epidemic still can be mitigated for initial states with S0 ≈ 1 and I0 ≈ 0 (pink trajectory). In this case, the optimal intervention starts when the initial condition hits the separating curve below Imax at t = 35. At that instant, the intervention starts with the maximum value umax, and continues in that form until the trajectory reaches Imax. (c) Choosing umax = 0.4 yields Rc = 2.184 > 1. In this case, the optimal intervention problem does not have a solution for all initial states S0 > 0.85. This is illustrated by pink trajectory: even when applying the maximum intervention from the start, I(t) will grow beyond Imax.

