Table 2.
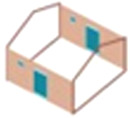
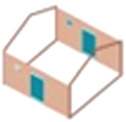
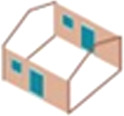
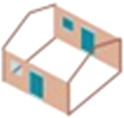
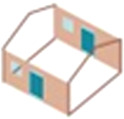
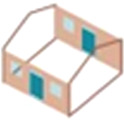
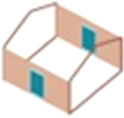
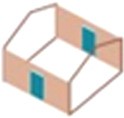
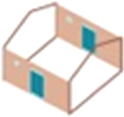
Effect of screened windows and door gaps on house entry by An. gambiae s.l. General linearized modelling results, adjusting for house position and night. Data are means (95% CI). Larger drawings of the house typologies are shown in figure 1.
| screened window area (m2) (n = 25) | no. of An. gambiae s.l. per night (n = 25) | adjusted estimates, mean ratio | p-value | ||
|---|---|---|---|---|---|
| experiment 1: small-screened windows | |||||
|
two badly fitting small windows (reference) | — | 6.16 (4.07 to 8.25) | 1.0 | — |
|
one small-screened window | 0.09 | 6.44 (4.04 to 8.84) | 0.91 (0.65 to 1.28) | 0.586 |

|
two small-screened windows | 0.18 | 3.80 (1.15 to 6.45) | 0.60 (0.40 to 0.91) | 0.015 |

|
one small-screened window and one medium-screened window | 0.27 | 2.60 (1.22 to 3.98) | 0.37 (0.22 to 0.64) | <0.001 |
| experiment 2: large-screened windows | |||||
|
two badly fitting large windows (reference) | — | 11.04 (7.72 to 14.36) | 1.0 | — |
|
one large-screened window | 0.50 | 4.72 (3.16 to 6.28) | 0.43 (0.28 to 0.64) | <0.001 |
|
two large-screened windows | 1.00 | 2.64 (1.55 to 3.73) | 0.21 (0.14 to 0.32) | <0.001 |
|
three large-screened windows | 1.50 | 0.56 (0.15 to 0.97) | 0.05 (0.02 to 0.10) | <0.001 |
| experiment 3: door gaps | |||||
|
gap above and below the doors, no windows (reference) | — | 2.04 (1.45 to 3.35) | 1.0 | — |
|
gaps above the doors, no windows | — | 3.96 (2.43 to 5.49) | 1.28 (0.83 to 1.97) | 0.259 |

|
gap below the doors, no windows | — | 3.28 (2.13 to 4.43) | 1.30 (0.81 to 2.09) | 0.285 |
|
gaps above and below doors, with two small-screened windows | — | 2.92 (1.52 to 4.32) | 1.05 (0.63 to 1.76) | 0.844 |
