
Figure 3.
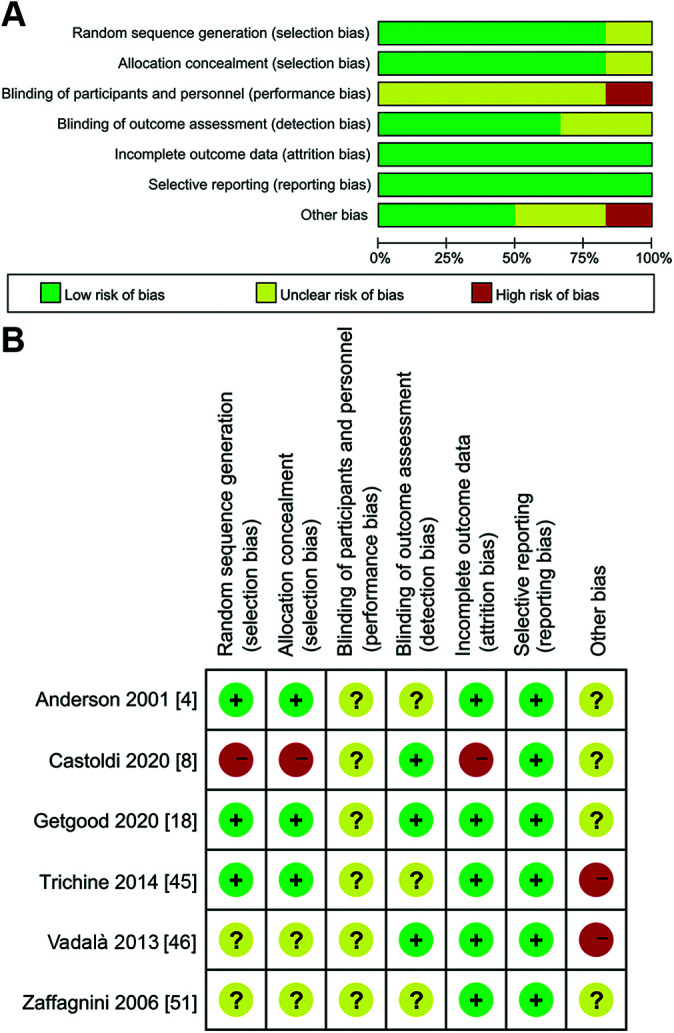
Quality assessment of the included studies. (A) Graph of the risk of different types of bias. (B) Summary of bias risk. + = low risk of bias; − = high risk of bias; ? = unclear or unknown risk of bias.
Official websites use .gov
A
.gov website belongs to an official
government organization in the United States.
Secure .gov websites use HTTPS
A lock (
) or https:// means you've safely
connected to the .gov website. Share sensitive
information only on official, secure websites.
Quality assessment of the included studies. (A) Graph of the risk of different types of bias. (B) Summary of bias risk. + = low risk of bias; − = high risk of bias; ? = unclear or unknown risk of bias.