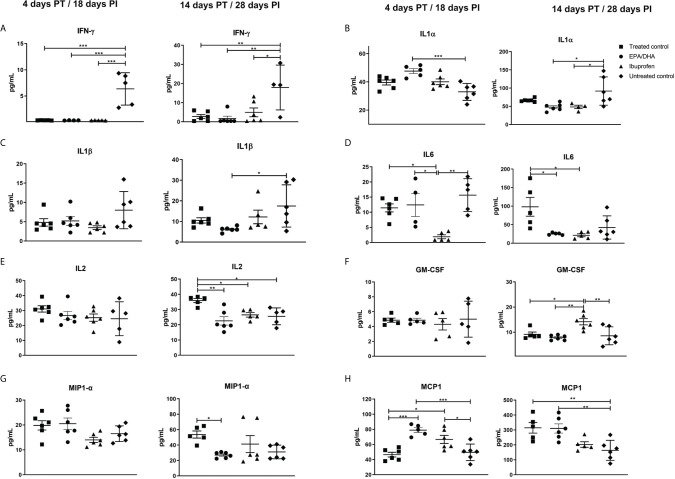
Figure 3.
Treatment effects on lung cytokine/chemokines levels. (A) IFN-γ, (B) IL-1α, (C) IL-1β, (D) IL6, (E) IL2, (F) GM-CSF, (G) MIP-1 α and (H) MCP-1. All data are presented in pg/mL. All mice except untreated controls were on standard TB antibiotics Rifafour® for 4 days of treatment, then rifampicin and isoniazid (RH) for 10 days. All values represent mean ± SEM. Results repeated in two experiments, data shown for one experiment (n = 6 per group). One-way ANOVA followed by Tukey’s post-hoc test was used to compare means, *P < 0.05, **P < 0.01, ***P < 0.001. EPA, eicosapentaenoic acid; DHA, docosahexaenoic acid; IL, interleukin; IFN- γ, interferon γ; IL-1α, interleukin 1 alpha; IL-1β, Interleukin 1 beta, GM-CSF, granulocyte-macrophage colony-stimulating factor; MIP-1 α, macrophage inflammatory protein 1-alpha and MCP-1, Monocyte chemoattractant protein-1; PT, post-treatment; PI, post-infection.

