FIGURE 1.
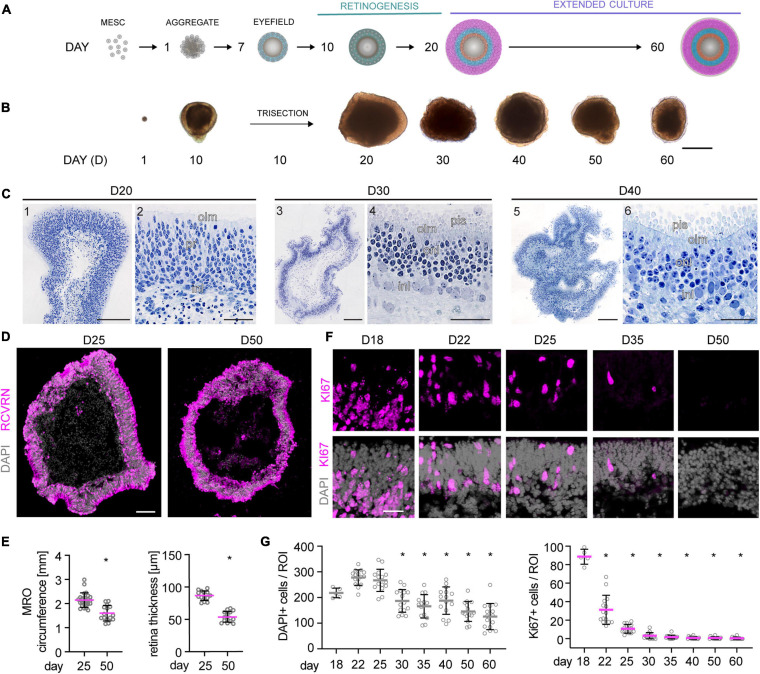
Morpho-histological characterization of MROs within longer-term culture. (A) Schematic of the experimental approach. Mouse retina organoids (MROs) were differentiated as previously described (Völkner et al., 2016, 2019) and analyzed at different timepoints in extended culture after the end of retinogenesis (postmitotic). (B) Representative phase contrast images of MROs at different stages of differentiation, showing organoid growth during the first 20 days of culture. Upon extended culture, organoid size decreases and epithelia become less optically translucent. (C) Histology of methacrylate resin embedded MROs. (C1,2) D20, overview (1) and detail (2) showing a regular neuroepithelial layer with photoreceptors (pr) and interneurons (in). (C3,4) D30, overview (3) and detail (4) showing MRO with well-developed inner and outer nuclear layers (inl, onl), outer limiting membrane (olm) and photoreceptor inner segment (pis). (C5,6) D40, overview (5) and detail (6) showing photoreceptors with well-defined inner segments, a clear olm, but less clear border between outer and inner nuclear layers. (D) Overview image of organoid cryosections at D25 and D50 stained for RCVRN (photoreceptors) and DAPI. MROs decrease in size and the epithelia appear thinner at D50. (E) Quantification of MRO circumference and epithelial thickness on retinal cryosections. *p < 0.0001 (Student’s t-test). (F–G) Representative images and quantification of cell cycle marker KI67 and DAPI in MRO in extended culture. At D18, KI67 is still detected in many cells, but it becomes rapidly reduced thereafter, suggesting MRO become and remain postmitotic. The total cell number (DAPI) per region of interest (ROI) decreases from D30, suggesting cell loss. MRO were derived from (N) independent differentiations: D18 N = 1, all others N = 3. *p < 0.0001 (ANOVA). D, day. Scale bars: (B) 500 μm; (C) 1, 3, 5: 200 μm, and 2, 4, 6: 50 μm; (D) 100 μm; (F) 25 μm.

