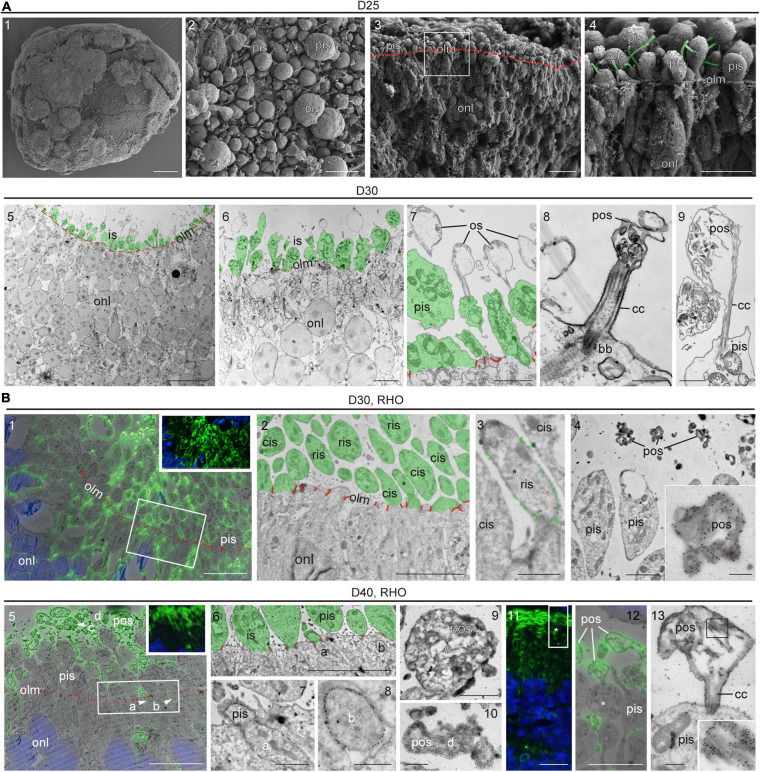
FIGURE 4.
Ultrastructure of photoreceptor maturation and outer segments formation. (A1–4) Scanning electron microscopy (SEM) of D25 MROs. (A1) overview of whole organoid, (A2) surface of organoid with photoreceptor inner segments. (A3,4) SEM of retinal organoid after dissection, the sample fractured preferentially between cell borders (cross-section). (A3) Overview, the outer limiting membrane (i.e., apical surfaces of MRO cells) is indicated by the red dashed line. (A4) The region indicated by the square in (A3). Cilia emerging from the inner segments are pseudo-colored in green. (A5–9) Transmission electron microscopy (TEM) of D30 epoxy embedded retinal organoid. Photoreceptor inner segments are pseudocolored in green and outer limiting membrane (cell junctions) is indicated in red. Inner segments are abundant (A5,6) and disorganized membrane structures (e.g., bubbles with disorganized membrane material) can be observed, that are linked to the photoreceptors by connecting cilia (A7–9). These structures may represent outer segment equivalents. (B) Tokuyasu cryo-sections labeled with antibodies against rhodopsin (RHO) for correlative light electron microscopy (CLEM). (B1–4) D30, (B1: insert) immunofluorescence, (B1: overlay) fluorescence and TEM, note the membrane staining (inner segments and other parts of the photoreceptor cells). Non-labeled photoreceptor cells are presumably cones. The square indicates the region displayed in (B2). (B2) Organoid surface with photoreceptors, RHO-positive inner segments are rod inner segments (ris), RHO-negative inner segments are cone inner segments (compare to B1), the asterisk indicates the inner segment shown in (B3). (B3) Inner segments at higher magnification (2x cis, 1x ris/*), the gold particle labeling is highlighted by larger green dots. (B4) Inner segments and heavily stained photoreceptor outer segment equivalents (pos), one of which is shown at higher magnification (insert). (B5–13) D40 (B5) insert, immunofluorescence, (B5) overlay fluorescence and TEM. 4 ROI’s are indicated (arrowheads). The rectangle indicates the region shown in (B6). (B6–8) surface of the MRO with two labeled parts of rods (ROI a and b), that are shown in (B7,B8) at higher magnification. (B9,10) Two photoreceptor outer segment equivalents (pos, ROIs c and d) at higher magnification. (B11–13) RHO-CLEM in a different region of the MRO. (B11) fluorescence, the rectangle indicates the region shown in (B12), the asterisk indicates the ROI shown in B13. (B12) Overlay fluorescence and TEM, labeled pos are shown, one of which is connected to an inner segment (*). (B13) ROI with outer segment, connecting cilium (cc) and inner segment at higher magnification, insert shows heavily stained membrane structures of the outer segment from the region indicated by the square. D, day; olm, outer limiting membrane; pis, photoreceptor inner segment; ris, rod inner segment; cis, cone inner segment; pos, photoreceptor outer segment; onl, outer nuclear layer; cc, connecting cilium; bb, basal body; ROI, region of interest. Scale bars: (A) 1: 100 μm, 2: 5 μm, 3: 10 μm, 4: 5 μm, 5: 20 μm, 6: 5 μm, 7: 2 μm, 8: 500 nm, 9: 1 μm; (B) 1: 10 μm, 2: 5 μm, 3: 1 μm, 4: 2 μm, 4 insert: 500 nm, 5: 10 μm, 6: 5 μm, 7: 1 μm, 8: 500 nm, 9: 1 μm, 10: 500 nm; 11: 10 μm, 12: 5 μm, 13: 500 nm.

