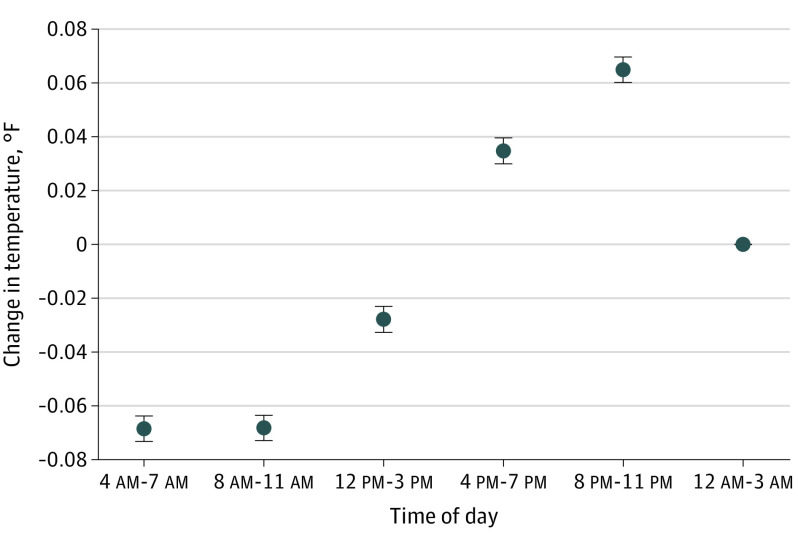
Figure. Diurnal Variation in Oral Temperature of Noninfected Hospitalized Patients.
The graph shows mean change in temperature with 95% CI error bars for the time-of-day variable in the mixed linear regression model on oral temperature, which includes the covariables listed in the Table.

