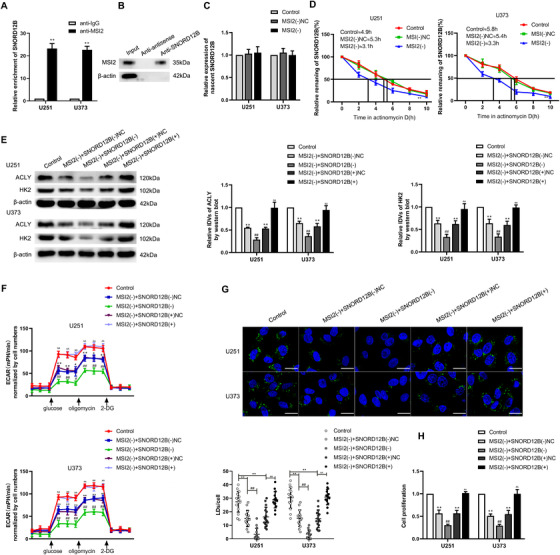
FIGURE 3.

MSI2 facilitated glycolipid metabolism of GBM cells by increasing SNORD12B stability. (A) An enrichment of SNORD12B in MSI2 immunoprecipitated samples via RNA immunoprecipitation (RIP) assay. ** p < .01 versus anti‐IgG group, using Student's t‐test. (B) RNA pull‐down assay followed by Western blot showed the specific associations of MSI2 with biotinylated‐SNORD12B or antisense RNA. (C) Expression of nascent SNORD12B was measured via qRT‐PCR after MSI2 knockdown. (D) Half‐life of SNORD12B was measured by qRT‐PCR after actinomycin D treated in U251 and U373 cells. ** p < .01 versus MSI2(−)NC group. (E) Regulation of HK2 and ACLY expression by MSI2 and SNORD12B was analyzed via Western blot. (F) ECAR was used to measure glycolysis and glycolytic capacity of U251 and U373 cells. * p < .05 versus control group; ** p < .01 versus control group; # p < .05 versus MSI2(−) + SNORD12B(−)NC group; ## p < .01 versus MSI2(−) + SNORD12B(−)NC group; ΔΔ p < .01 versus MSI2(−) + SNORD12B(+)NC group. (G) Representative confocal fluorescence imaging of LDs stained by BODIPY 493/503 (green) in U251 and U373 cells. Nucleus (blue) was stained by DAPI. Scale bars = 20 μm. Data are presented as the mean ± SD (n = 15, each group). ** p < .01 versus control group; ## p < .01 versus MSI2(−) + SNORD12B(−)NC group; ΔΔ p < .01 versus MSI2(−) + SNORD12B(+)NC group . (H) Effect of MSI2 and SNORD12B on proliferation was analyzed via CCK‐8. ** p < .01 versus control group; ## p < .01 versus MSI2(−) + SNORD12B(−)NC group; ΔΔ p < .01 versus MSI2(−) + SNORD12B(+)NC group. Except for specially noted, data are presented as the mean ± SD of three independent experiments per group. Statistical analysis was by one‐way ANOVA method
