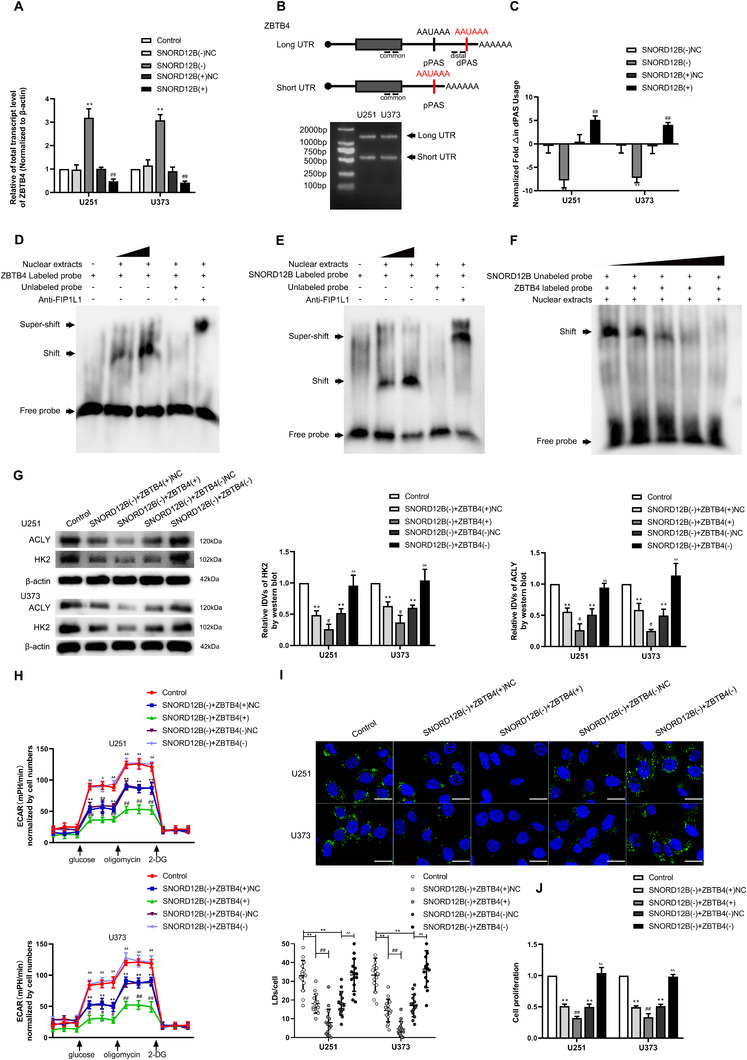
FIGURE 5.

SNORD12B regulated alternative polyadenylation of ZBTB4 by competitively binding to FIP1L1. (A) Effect of SNORD12B on the expression of ZBTB4 mRNA was analyzed by qRT‐PCR. ** p < .01 versus SNORD12B(−)NC group; ## p < .01 versus SNORD12B(+)NC group by one‐way ANOVA. (B) Diagram showing two polyadenylation signals (PAS) in the 3′UTR of ZBTB4 and the primers specifically designed for the detection of total transcript and long 3′UTR transcript (above). 3′‐Random amplification of cDNA ends (3′RACE) PCR amplify full length 3′UTR of ZBTB4 (below). (C) qRT‐PCR was conducted to analyze the effect of SNORD12B on the utilization of distal polyadenylation signal (dPAS) in U251 and U373 cells. ** p < .01 versus SNORD12B(−)NC group; ## p < .01 versus SNORD12B(+)NC group by one‐way ANOVA. (D) RNA electrophoretic mobility shift assay (EMSA) showed binding affinity between ZBTB4 and FIP1L1. (E) RNA EMSA showed SNROD12B could bind to FIP1L1. (F) Competitive gel mobility shift assay was performed to detect SNORD12B and ZBTB4 competitively binding to FIP1L1. (G) Regulation of HK2 and ACLY expression by SNORD12B and ZBTB4 was analyzed via Western blot. (H) ECAR to measure glycolysis and glycolytic capacity of U251 and U373 cells regulated by SNORD12B and ZBTB4. **p < .01 versus control group; # p < .05 versus SNORD12B(−) + ZBTB4(+)NC group; ## p < .01 versus SNORD12B(−) + ZBTB4(+)NC group; Δ p < .05 versus SNORD12B(−)+ZBTB4(−)NC group; ΔΔ p < .01 versus SNORD12B(−) + ZBTB4(−)NC group. (I) Representative confocal fluorescence imaging of LDs stained by BODIPY 493/503 (green) in U251 and U373 cells. Nucleus (blue) was stained by DAPI. Scale bars = 20 μm. Data are presented as the mean ± SD (n = 15, each group). **p < .01 versus control group; ## p < .01 versus SNORD12B(−) + ZBTB4(+)NC group; ΔΔ p < .01 versus SNORD12B(−) + ZBTB4(−)NC group. (J) Effect of SNORD12B and ZBTB4 on the proliferation was analyzed via CCK‐8 assay. **p < .01 versus control group; ## p < .01 versus SNORD12B(−) + ZBTB4(+)NC group; ΔΔ p < .01 versus SNORD12B(−) + ZBTB4(−)NC group. Except for specially noted, data are presented as the mean ± SD of three independent experiments per group. Statistical analysis was by one‐way ANOVA method
