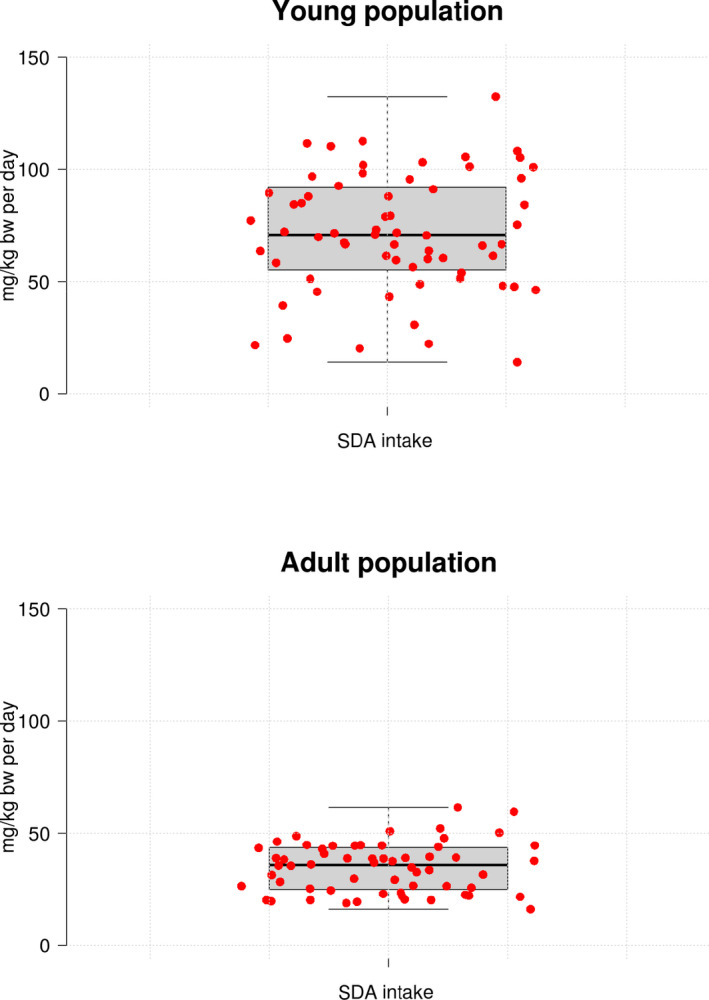
Figure 3.

Dietary intake estimations of SDA (95th percentiles) in the young population (infants, toddlers, other children and adolescents) and in the adult population (adults, elderly, very elderly, pregnant women and lactating women) across different European countries. Whiskers in the box‐plot represent the minimum and the maximum estimates, top and bottom of the box represent first and third quartiles, respectively, and the median is indicated with a horizontal line in the interior of the box
