Figure 1.

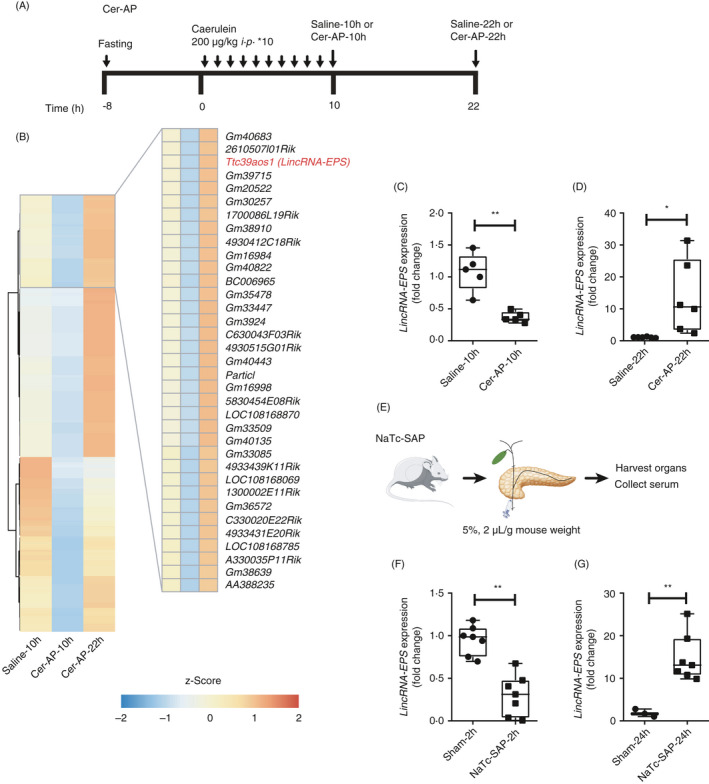
Dynamic alternation of lincRNA‐EPS expression during AP progression. (A) Schematic diagram of the Cer‐AP mouse model. (B) Transcriptomes of pancreases from the saline‐10h, Cer‐AP‐10h and Cer‐AP‐22h mice were analysed by RNA‐Seq. Heatmap of the representative lncRNAs (Cer‐AP‐10h/saline‐10h ≤ 0·5‐fold and Cer‐AP‐22h/Cer‐AP‐10h ≥ 2 fold) that were downregulated at the early stage and recovered expression at the later stage are shown. (C) RT‐qPCR analysis of lincRNA‐EPS transcripts in the pancreases from saline‐10h (n = 5) and Cer‐AP‐10h (n = 5) mice. (D) RT‐qPCR analysis of lincRNA‐EPS transcripts in the pancreases from saline‐22h (n = 6) and Cer‐AP‐22h (n = 6) mice. (E) Schematic diagram of the experimental SAP mouse models by pancreatic ductal retrograde infusion of NaTc. (F) RT‐qPCR analysis of lincRNA‐EPS transcripts in the pancreases from sham‐2h (n = 7) and NaTc‐SAP‐2h (n = 7) mice. (G) RT‐qPCR analysis of lincRNA‐EPS transcripts in the pancreases from sham‐24h (n = 3) and NaTc‐SAP‐24h (n = 7) mice. Data of (B) are shown as the mean of the biological triplicates. Data of (C), (D), (F) And (G) are shown as the mean ± SD of one representative experiment from three independent experiments. *P < 0·05 and **P < 0·01 by unpaired Student's t‐test.
