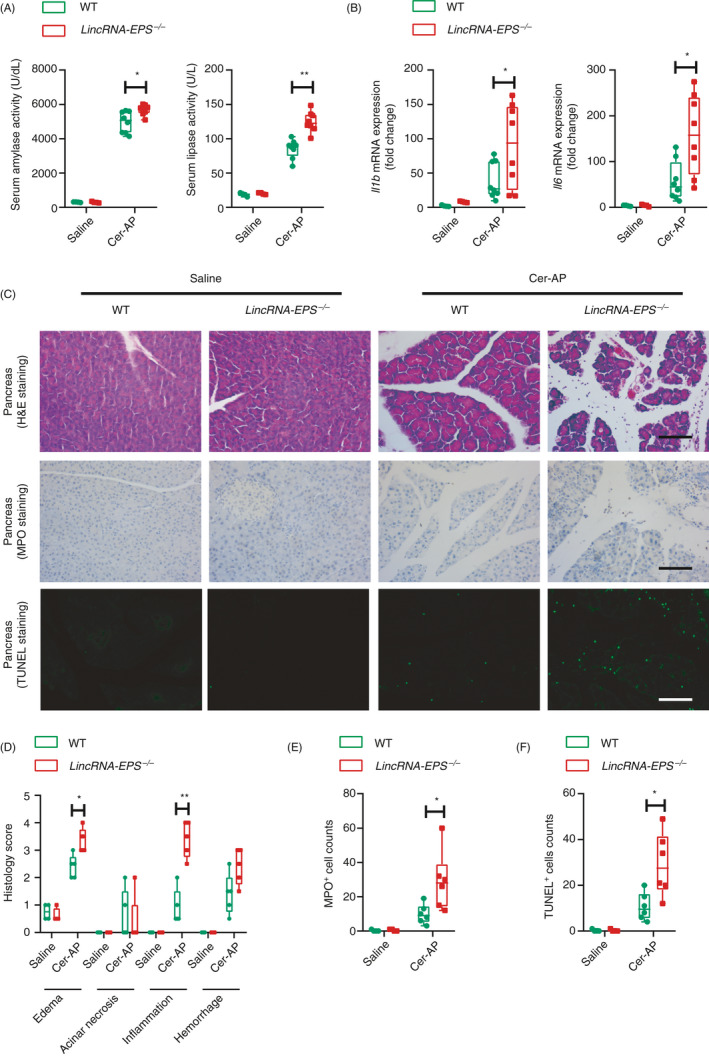
Figure 2.

lincRNA‐EPS protects mice against Cer‐AP. (A) 24 hr post the initial injection of saline or caerulein, activities of the serum amylase (left panel) and lipase (right panel) of saline WT (n = 4), saline lincRNA‐EPS‐/‐ (n = 4), Cer‐AP WT (n = 8) and Cer‐AP lincRNA‐EPS‐/‐ (n = 8) mice were measured via enzymatic methods. (B) RT‐qPCR analysis of the Il1b and Il6 mRNA expression in the pancreases from the mice described in (A). (C) Histological examination of the pancreas sections from the indicated mice by H&E staining (upper panel). Neutrophils infiltration in the pancreases from the indicated mice were measured by MPO staining (middle panel). Necrotic cells in the pancreases from the indicated mice were measured by TUNEL staining (bottom panel). Data are shown as representative pancreas sections from the indicated mice; scale bar, 100 µm. Saline WT (n = 4), Saline lincRNA‐EPS‐/‐ (n = 4), Cer‐AP‐WT (n = 5) and Cer‐AP‐lincRNA‐EPS‐/‐ (n = 5). (D–F) Histology scores of pancreatitis (D), MPO+ cells (E) and TUNEL+ cells (F) were calculated based on the representative field of the pancreas sections from the indicated mice, group size was described in (C). Data of (A), (B), (D), (E) And (F) are shown as mean ± SD of one representative experiment from three independent experiments. *P < 0·05 and **p < 0·01 by unpaired Student's t‐test.
