
Figure 6.
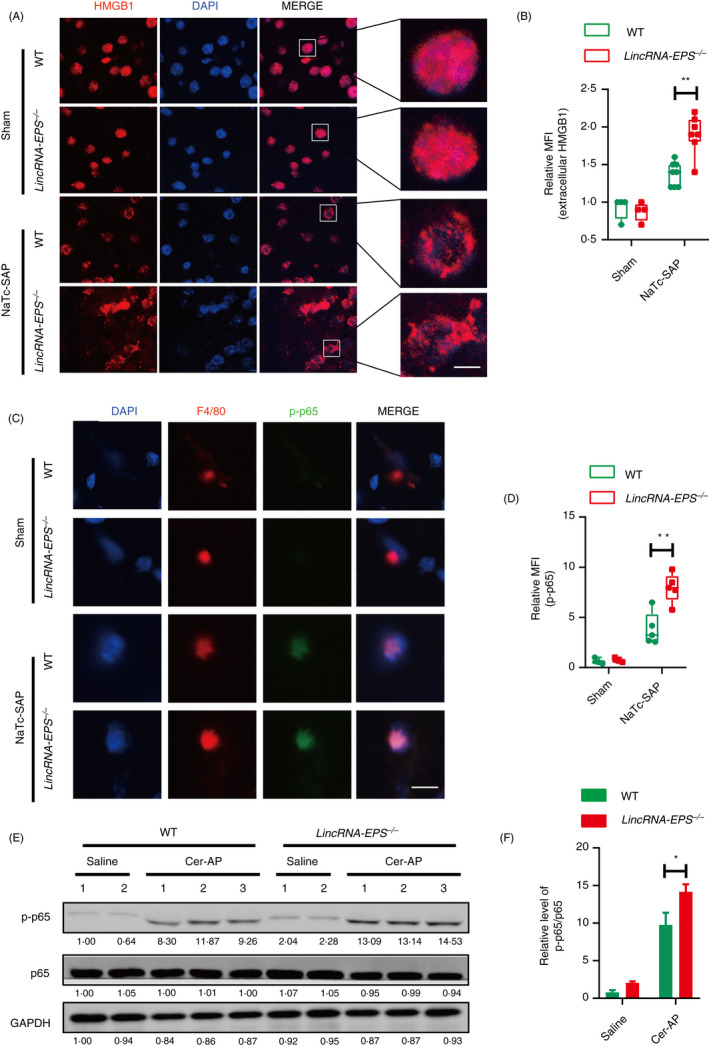
LincRNA‐EPS reduces the release of HMGB1 from acinar cells and the activation of NF‐B in the pancreatic macrophages from NaTc‐SAP mice. (A, B) Immunofluorescence of the subcellular localization of HMGB1 was measured in the snap‐frozen pancreas sections from indicated mice (A), and the mean fluorescent intensity (MFI) of extracellular HMGB1 was calculated in the representative field of the sections (B); sham WT (n = 4), sham lincRNA‐EPS‐/‐ (n = 4), NaTc‐SAP WT (n = 8) and NaTc‐SAP lincRNA‐EPS‐/‐ (n = 8). (C, D) Immunofluorescence of the p‐p65 in the sorted pancreatic macrophages was measured (C), and the MFI of p‐p65 was calculated in the representative field of the sections. Sham WT (n = 4), Sham lincRNA‐EPS‐/‐ (n = 4), NaTc‐SAP WT (n = 5) and NaTc‐SAP lincRNA‐EPS‐/‐ (n = 5). (E, F) Western blot analysis of p‐p65 and total p65 in the pancreas lysate from the indicated mice (E), and relative p‐p65 protein level in (E) were quantified using the ImageJ software (F). GAPDH was shown as a loading control. Data of (A) and (C) are shown as representative pancreas sections from the indicated mice; scale bar, 5 µm (A) and 10 µm (C). Data of (E) are shown as representative of three independent experiments. Data of (B) and (D) are shown as the mean ± SD of one representative experiment from three independent experiments. *P < 0·05 and**P < 0·01 by unpaired Student's t‐test.