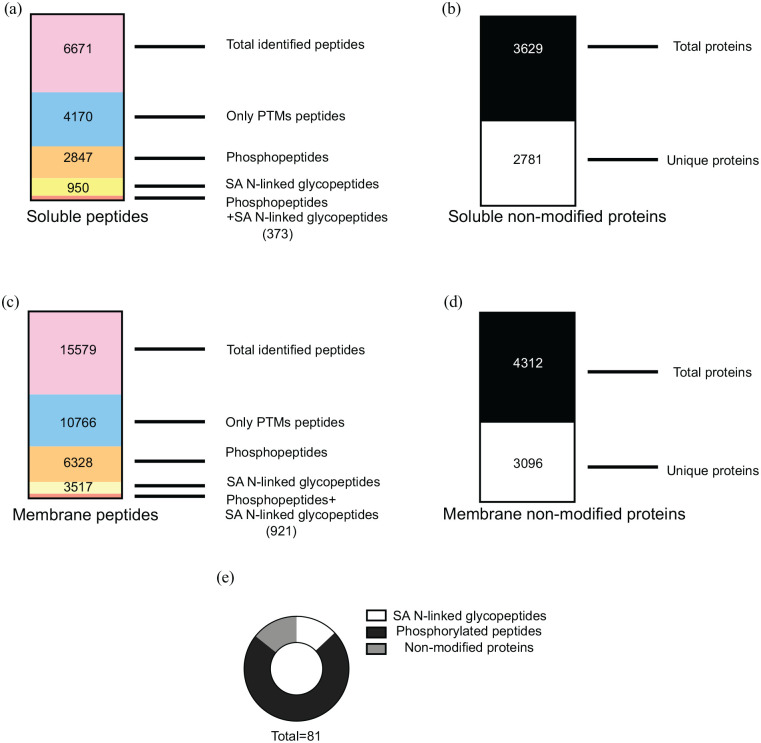
Figure 2.
(a) MS/MS data analysis for the soluble fraction was performed using Proteome Discoverer 2.1. A total number of 6671 peptides were detected. Multiple filtering using Excel was applied and 4170 post-translational modified peptides (PTMs) were found. Among those 2847 phosphopeptides and 950 SA N-linked glycopeptides were detected while 373 peptides contained both modifications in the same sequence, (b) from Proteome Discoverer 2.1 a list of soluble non-modified proteins was exported. A total number of 3629 proteins were detected and 2781 proteins represented by 2 or more peptides were filtered out and used for further analysis, (c) MS/MS data analysis for the membrane fraction was performed using Proteome Discoverer 2.1. A total number of 15 579 peptides were detected. Multiple filtering using Excel was applied and 10 766 PTMs were found. Among those 6328 phosphopeptides and 3517 SA N-linked glycopeptides were detected while 921 peptides contained both modifications in the same sequence, (d) from Proteome Discoverer 2.1 a list of membrane non-modified proteins was exported. A total number of 4312 proteins were detected and 3096 proteins represented by 2 or more peptides were filtered out and used for further analysis, and (e) cake-graph for significant peptides and proteins in the dataset. Statistical analysis (univariate ANOVA test) was performed for each subset of peptides in the dataset and 81 peptides were significantly changing in the high-fat diet (HFD) or high-glycaemic diet (HGD) compared to standard diet (SD) (P-value < .05 and −0.5 < FC > 1.5). The graph is showing the proportions between SA N-linked glycopeptides (white), phosphorylated peptides (black) and non-modified proteins (grey).

