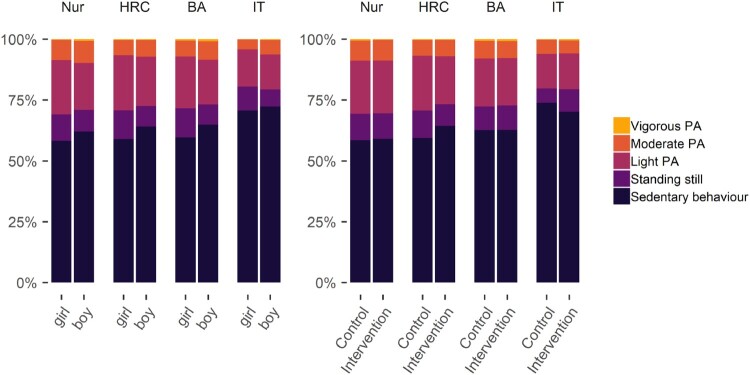
Figure 1.
Stacked bar plot drawn with R package ggplot (Wickham et al. (2018), code available at https://git.io/fptlp), showing proportions of accelerometer-measured physical activity (PA) in relation to measurement time, averaged over genders, arms and educational tracks. Nur = Practical nurse, HRC = Hotel, restaurant and catering, BA = Business and administration, IT = Information and communications technology.

