Figure 5.

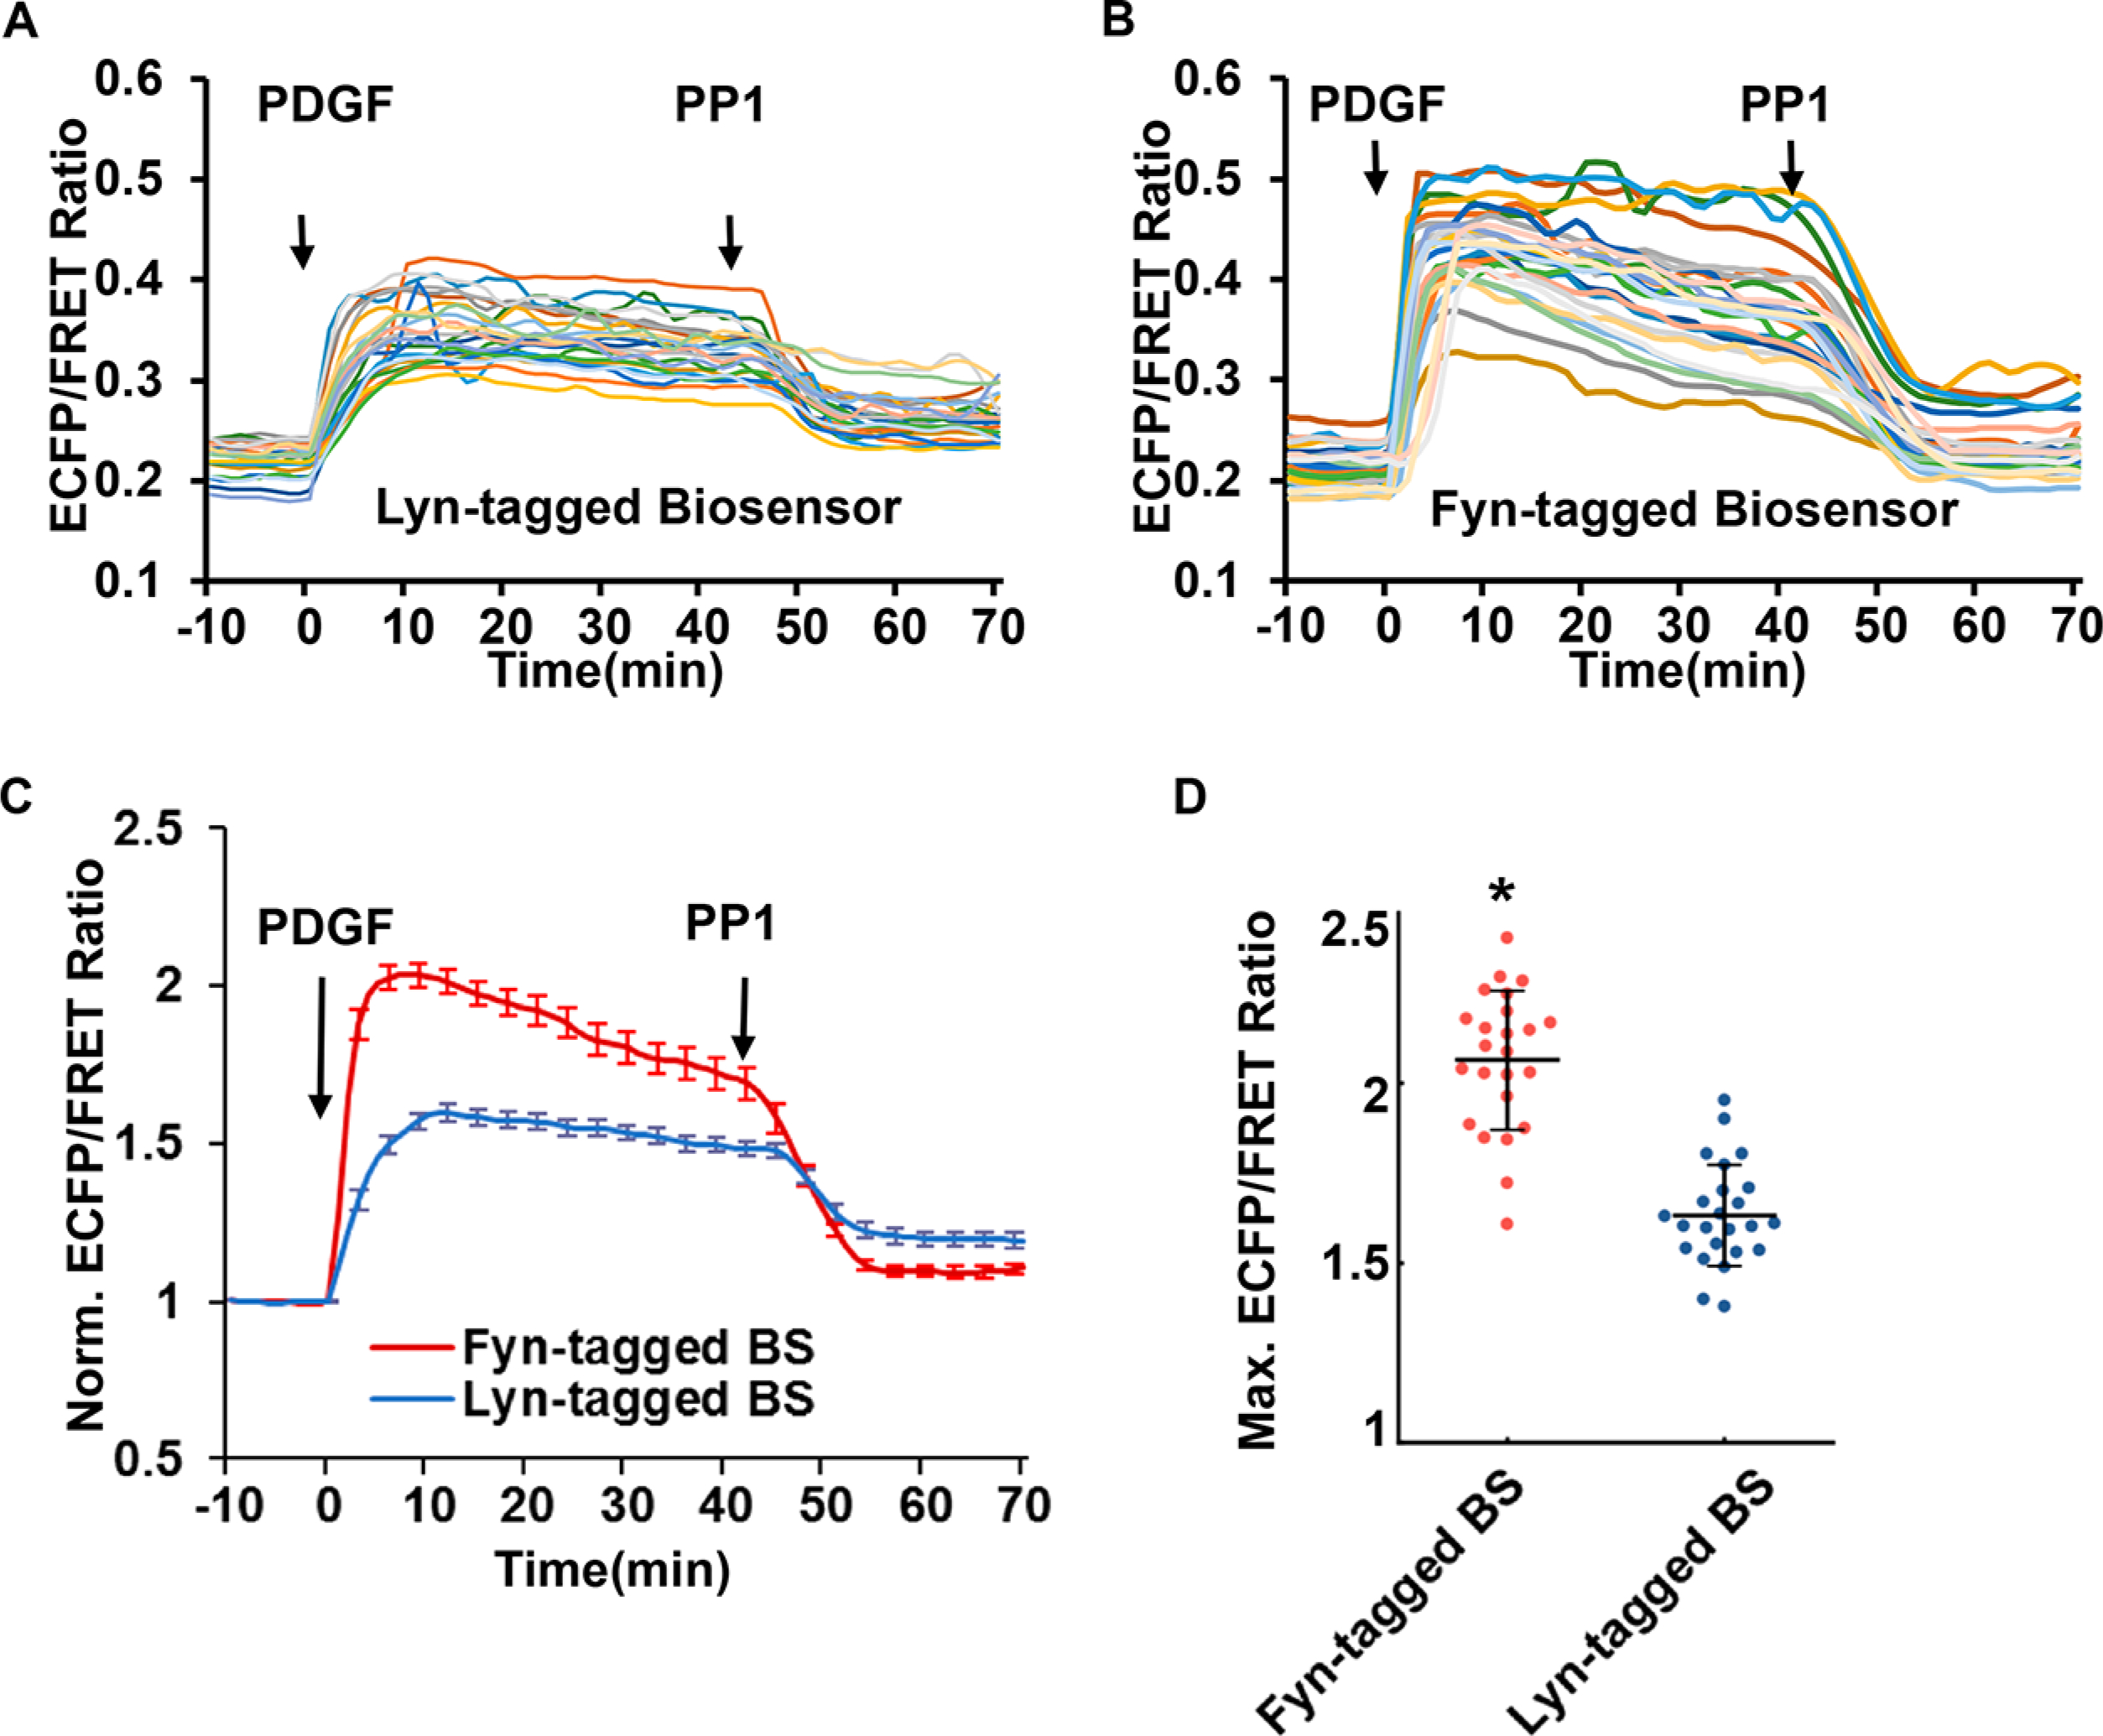
Detection of distinct Fyn activity by Lyn-tagged or Fyn-tagged biosensor. The time course curves show the PDGF-induced FRET response of (A) the Lyn-tagged biosensor or (B) the Fyn-tagged biosensor from a group of MEF cells, followed by the addition of Src family inhibitor PP1 (10 μM). Each colored line was quantified from one single cell. (C) The normalized time courses of the ECFP/FRET ratio from the group of cells in (A) and (B). Error bars: SEM. (D) Compare the normalized maximal ECFP/FRET ratio reported by the Fyn-tagged (scatter plots with mean ± SD: 2.06 ± 0.19) and Lyn-tagged (1.63 ± 0.14) biosensors after PDGF stimulation (* p < 0.001 by Student’s t test, n = 24).
