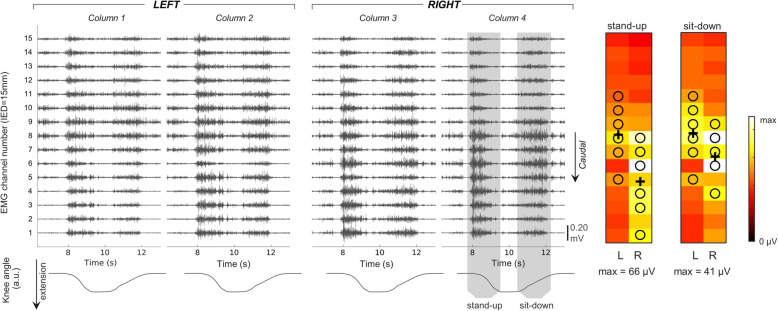
Fig. 2.
On the left: activation of the thoraco-lumbar extensor muscles for a single repetition of sit to stand task. Raw surface, single-differential EMGs (black traces) are depicted in the top row for each of the 60 channels separately. The knee kinematics, used to identify the identify the stand-up and sit-down phase of the movement, is depicted in the bottom row. On the right: an example of activity distribution during sit to stand task (Root Mean Square values averaged over five task repetitions). The centroid of channels is marked with a black cross; black circles indicate channels with amplitude > 70% of the maximum. The scale of each colormap is indicated in µV

