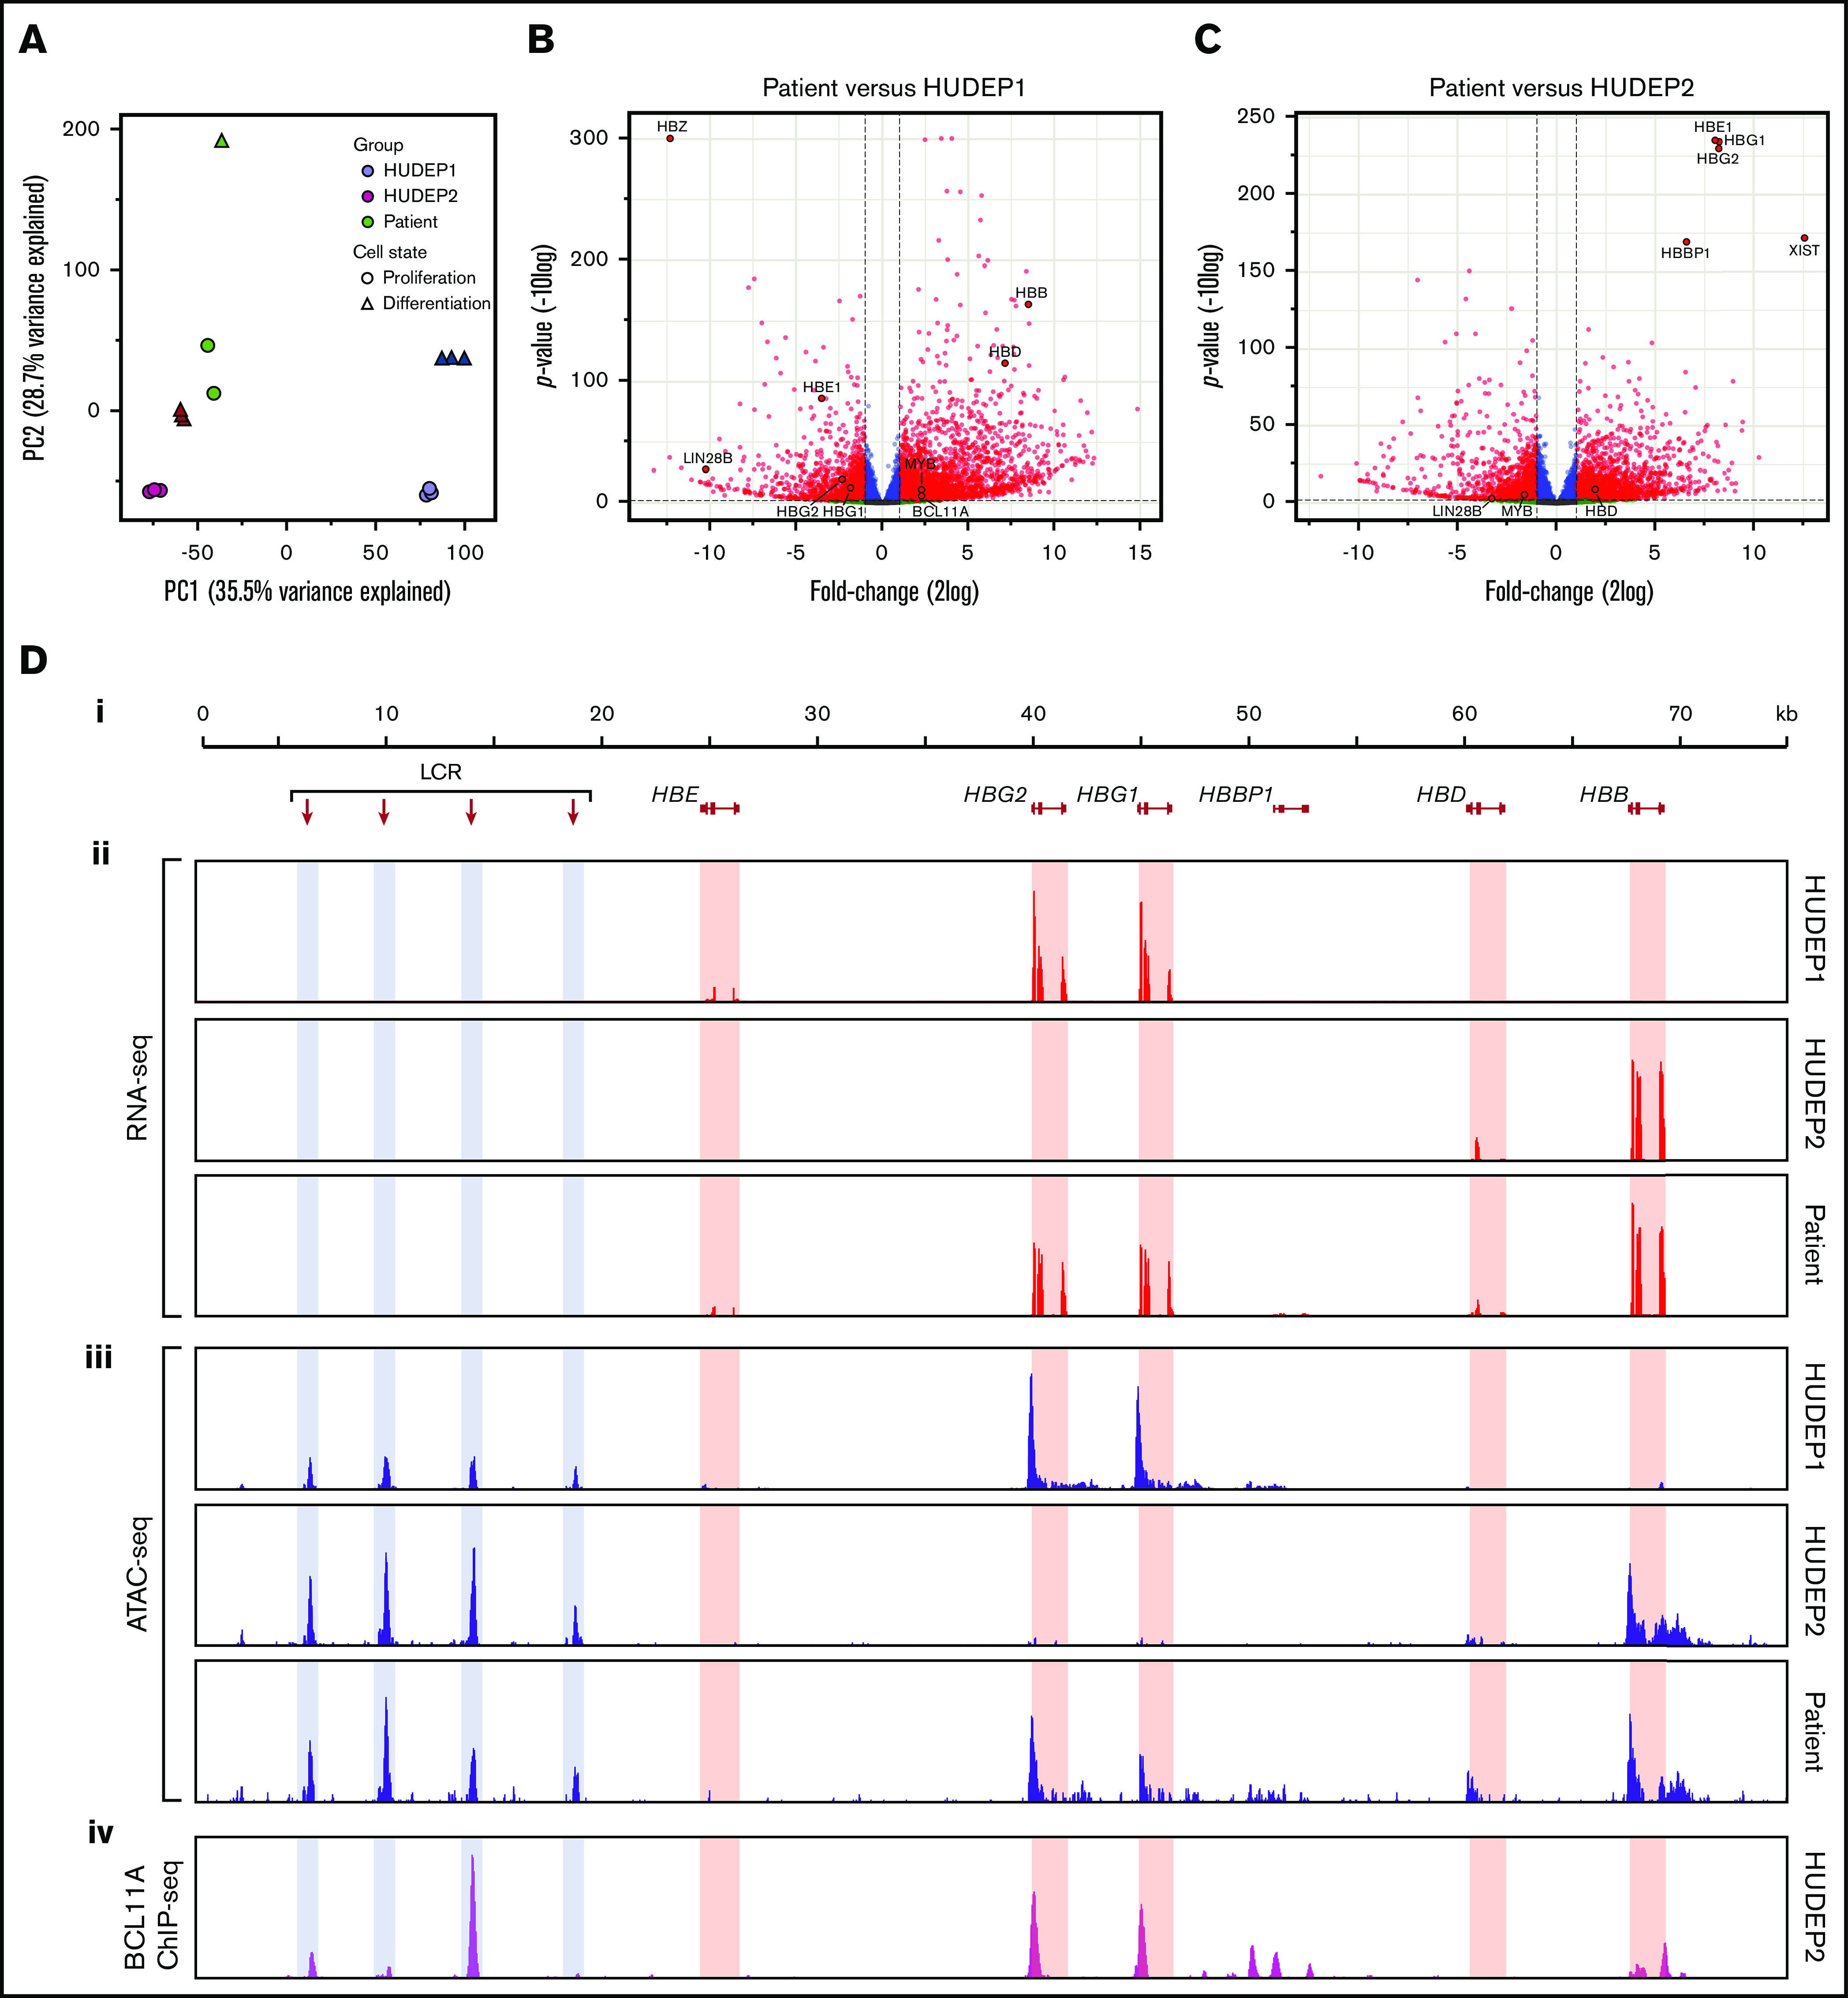
Figure 5.

RNA expression and chromatin accessibility at the HBB locus. (A) Principal component analysis of RNA-seq data. PC1 separates fetal cells (HUDEP1) from adult cells (HUDEP2 and patient). PC2 separates cells according to differentiation status. (B) Volcano plot of HUDEP1 cells vs patient RNA-seq data. (C) Volcano plot of HUDEP2 cells vs RNA-seq data. (D) An overview of the HBB locus (Di) with RNA expression (RNA-seq; red) (Dii) and chromatin accessibility (ATAC-seq; blue) (Diii) assays on HUDEP1 and HUDEP2 cells and patient HEPs. (Div) Binding of BCL11A to the HBB locus in HUDEP2 cells, as assessed by chromatin immunoprecipitation followed by NGS (ChIP-seq); data are from Martyn et al.64 HBB, β-globin gene; HBBP1, β-globin pseudogene 1; HBD, δ-globin gene; HBE, ε-globin gene; HBG1, Aγ-globin gene; HBG2, Gγ-globin gene; LCR, a series of enhancers marked by hypersensitive sites.
