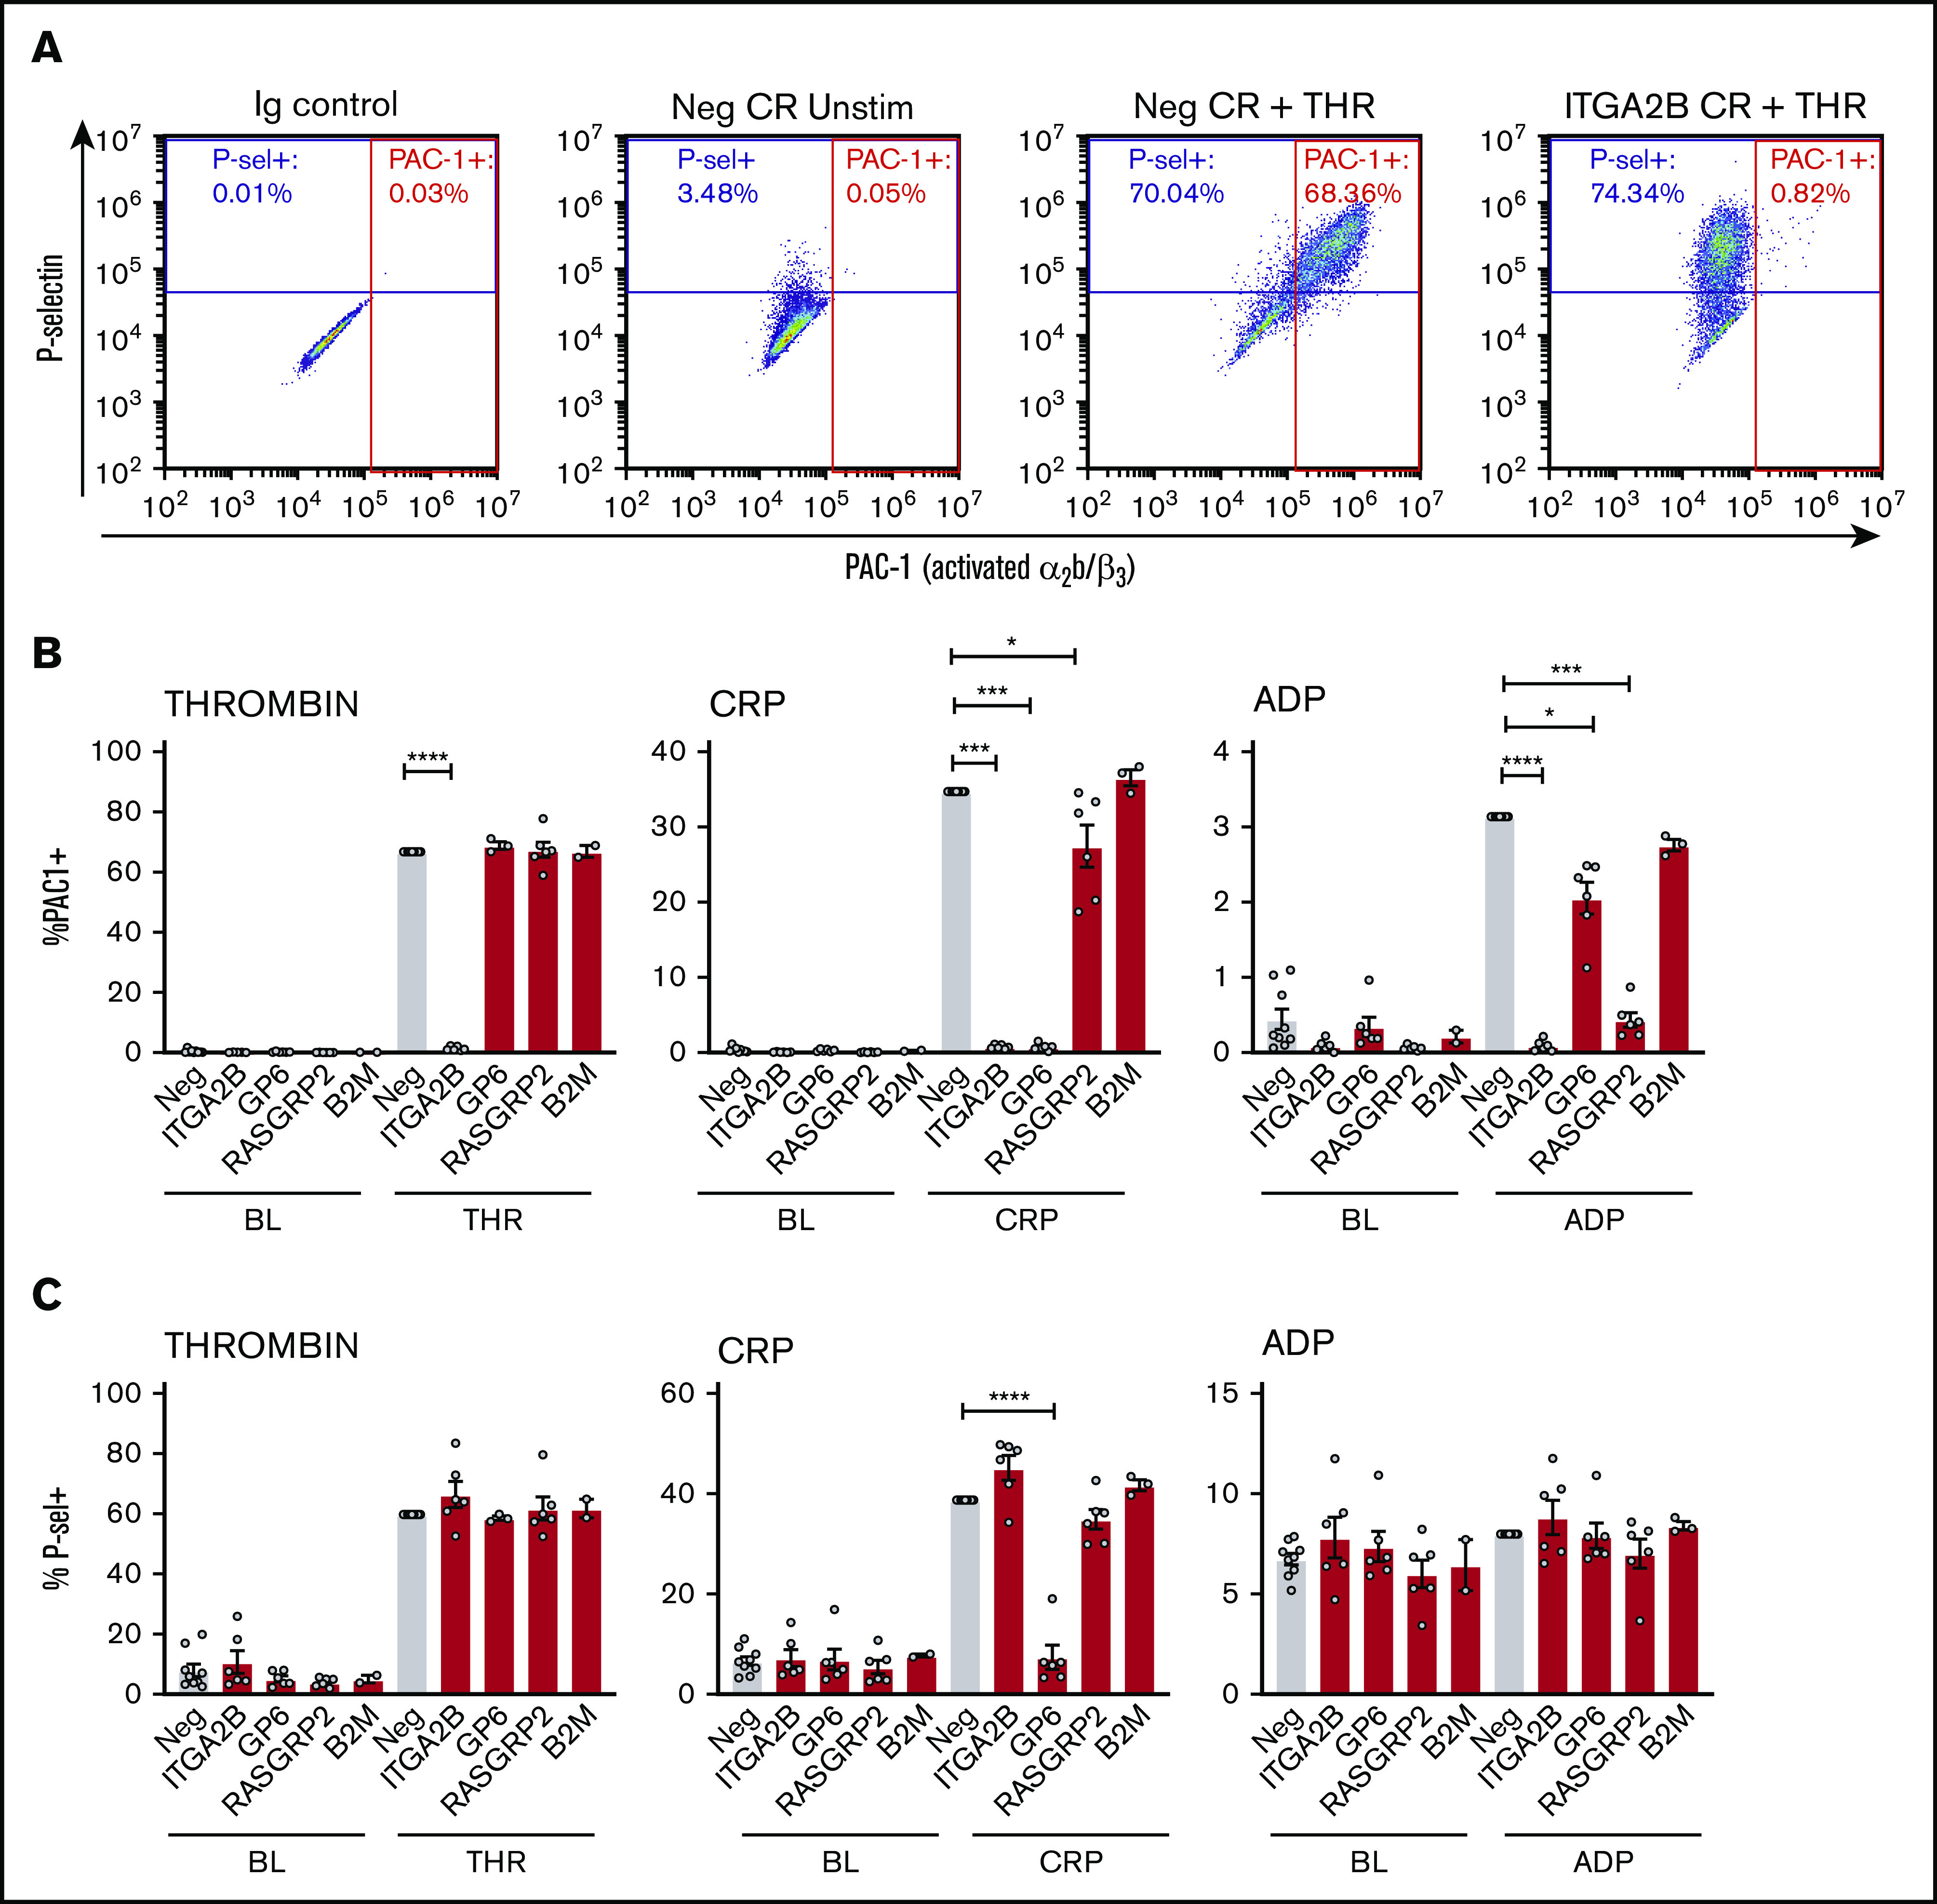
Figure 3.

Integrin activation and P-selectin exposure of CRISPR KO MKs in response to platelet agonists. Day 13 CRISPR (CR) KO and negative control CRISPR MKs were unstimulated (baseline [BL]) or treated for 10 minutes with thrombin (THR) (1 U/mL), CRP (1 μg/mL), or 2-methylthio-adenosine-5′-diphosphate (2-MeSADP; 200 nM). They were then stained for activated αIIb/β3 (PAC-1) and P-selectin and were analyzed by flow cytometry. (A) Representative flow cytometry plots of unstimulated (Unstim) vs thrombin-stimulated negative control and ITGA2B KO MKs. MKs were first gated as described in the legend for Figure 2B. Positive gates for PAC-1 (x-axis) and P-selectin (y-axis) were then set in reference to isotype (Ig) controls. (B-C) Normalized mean ± SEM summaries of the percentage of PAC-1–positive (B) or P-selectin–positive (C) cells (3-9 independent cords per group) for the CRISPR KO indicated on the x-axis. Mixed effects analysis with Dunnett’s adjustment for multiple comparisons: *P < .05; ***P < .001; ****P < .0001.
