Figure 6.

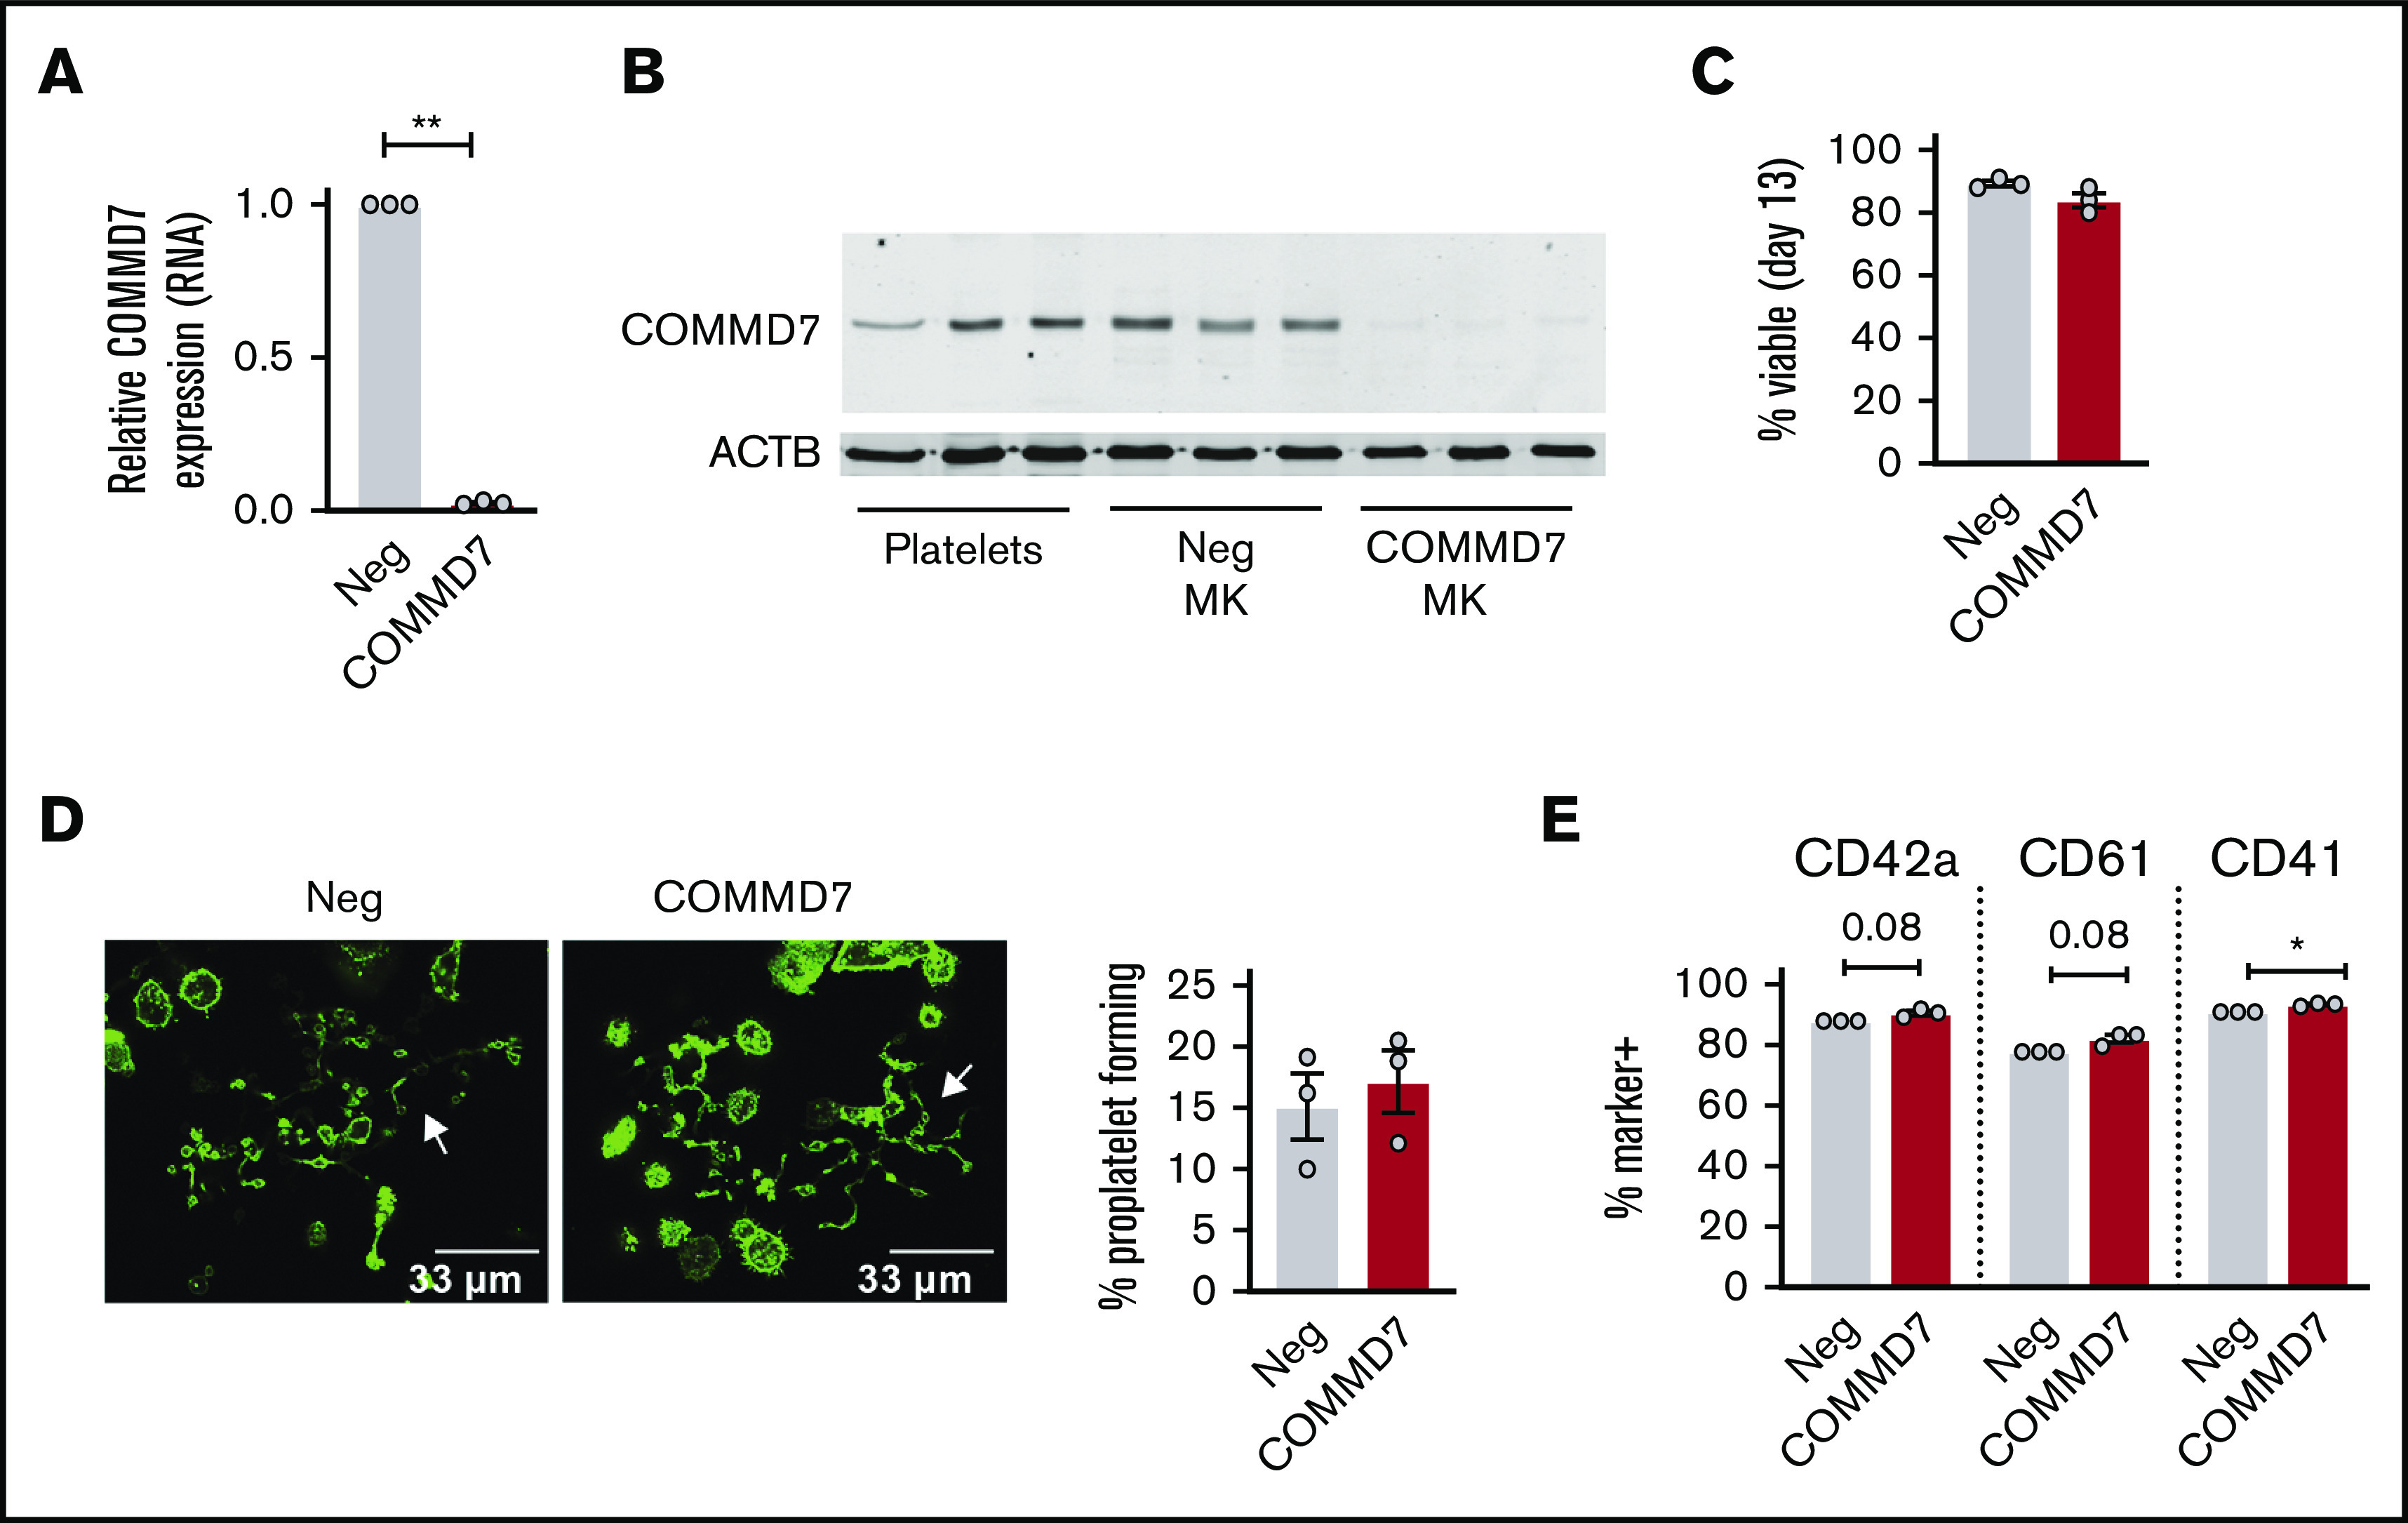
Effect of COMMD7 KO on megakaryopoiesis. (A) Real-time PCR analysis of COMMD7 RNA expression in COMMD7 CRISPR-treated day 13 MKs. Data are normalized to GAPDH (3 independent cords per group). (B) Western blot of COMMD7 protein in platelets from 3 healthy donors and in control and COMMD7 KO MKs from 3 independent cords per group. β-actin (ACTB) was used as loading control. (C) Percentage of viable negative control or COMMD7 KO cells on day 13 of culture. (D) Proplatelet formation on day 13 MKs plated overnight on fibrinogen and stained with Phalloidin 488. Shown are representative images of 10 random images taken from each of 3 cords. The percentage of control or COMMD7 KO MKs making proplatelets on day 13 was counted blinded to group and summarized in the bar graph on the right. (E) Flow cytometry analysis of MK maturation markers on day 13 control or COMMD7 MKs. Viable MKs were gated as in Figure 2B. Shown is the mean ± SEM of the percent of cells (y-axis) expressing MK maturation markers. Student t test: *P < .05; **P < .01.
