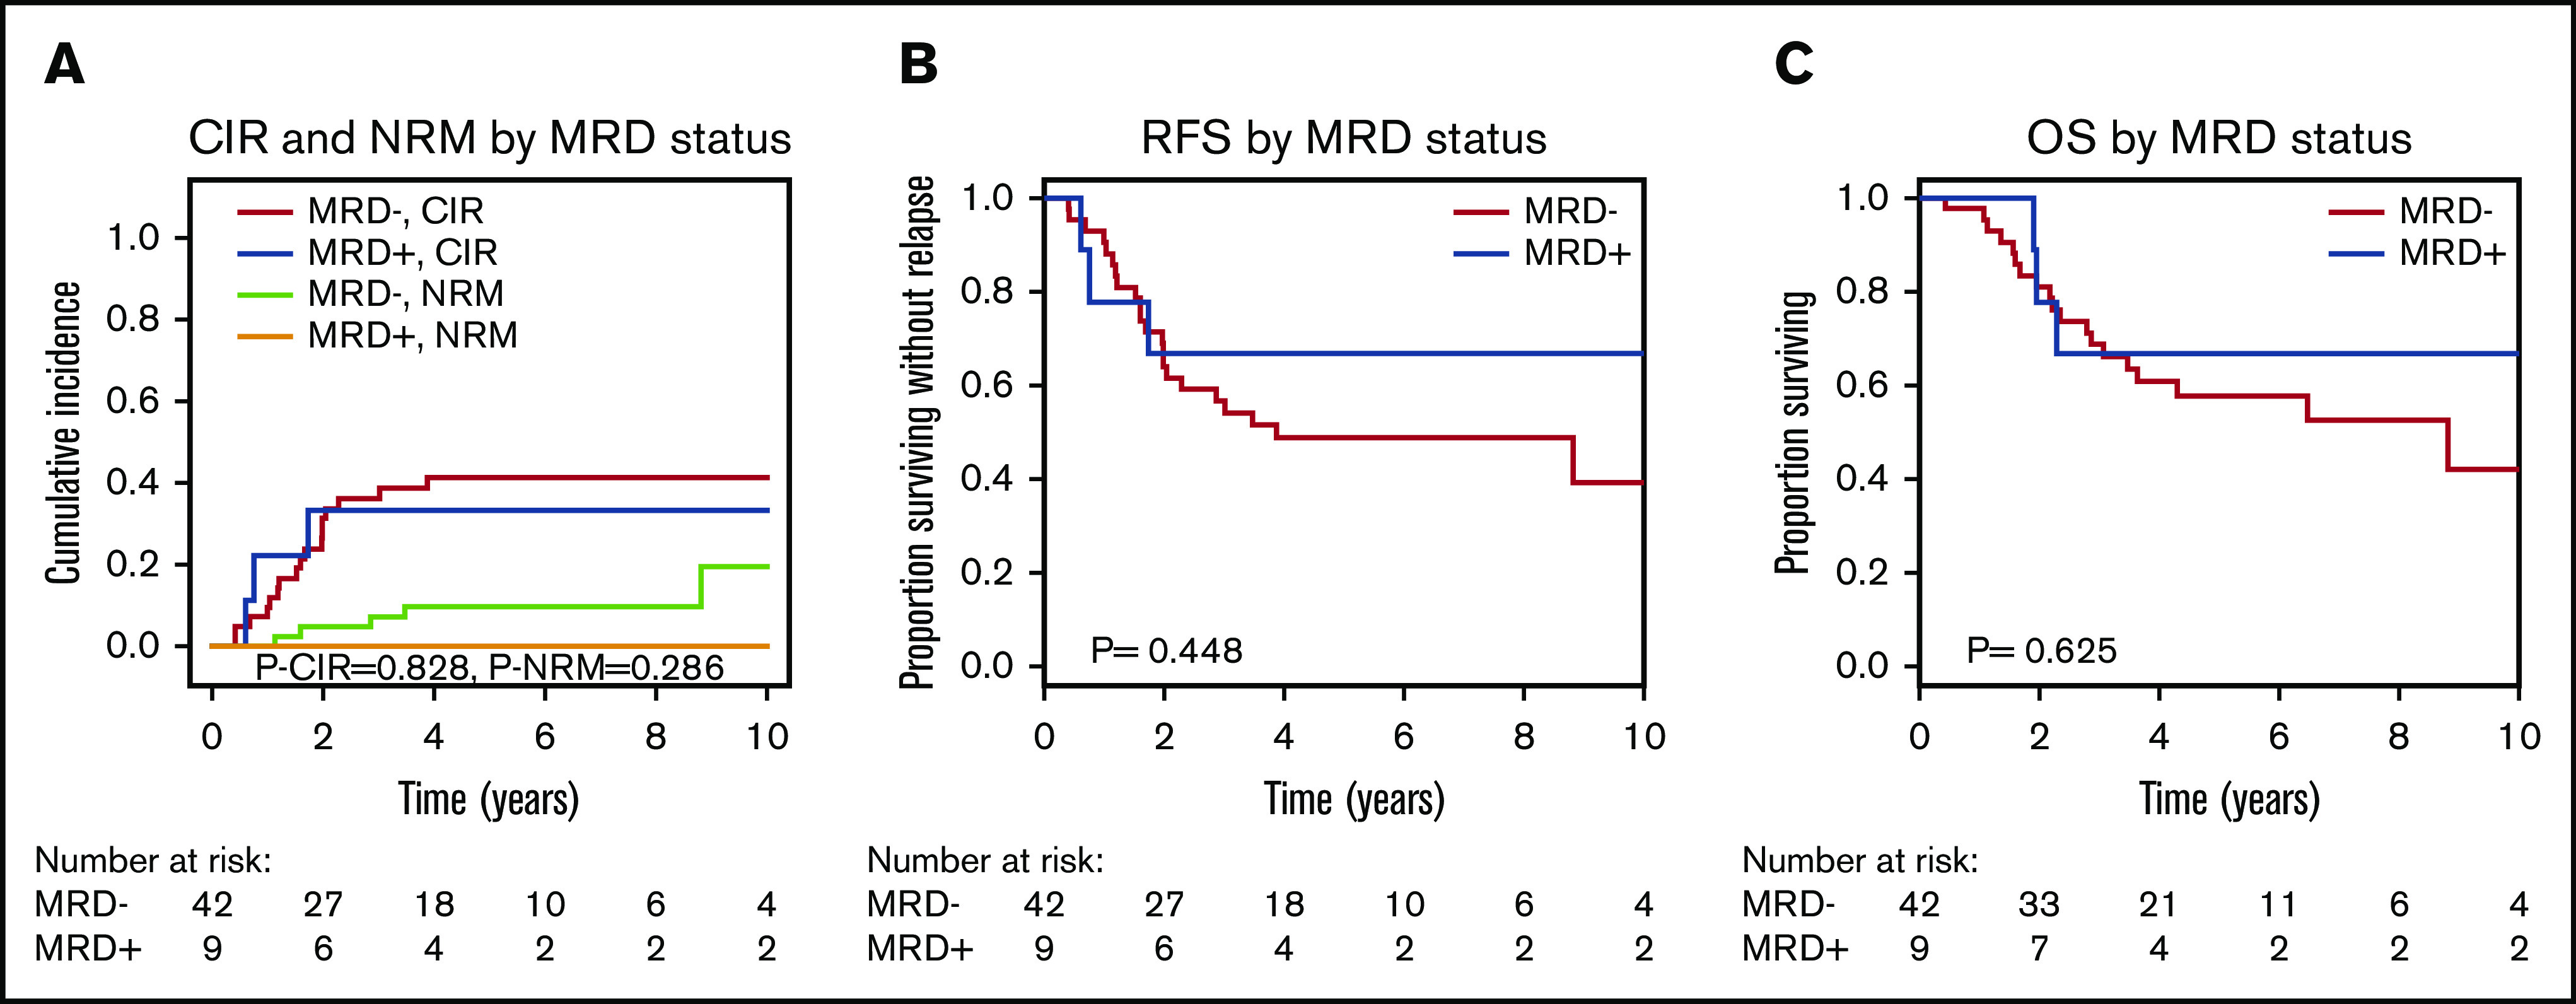
Figure 1.

CIR, NRM, RFS, and OS for patients who were MRD positive on day 90 or 180 compared with MRD-negative patients according to mutations in DTA genes (51 patients). (A) CIR and NRM by competing risk analysis for MRD-positive (n = 9) and MRD-negative (n = 42) patients. (B) RFS for MRD-positive (n = 9) and MRD-negative (n = 42) patients. (C) OS for MRD-positive (n = 9) and MRD-negative (n = 42) patients.
