
Figure 3.
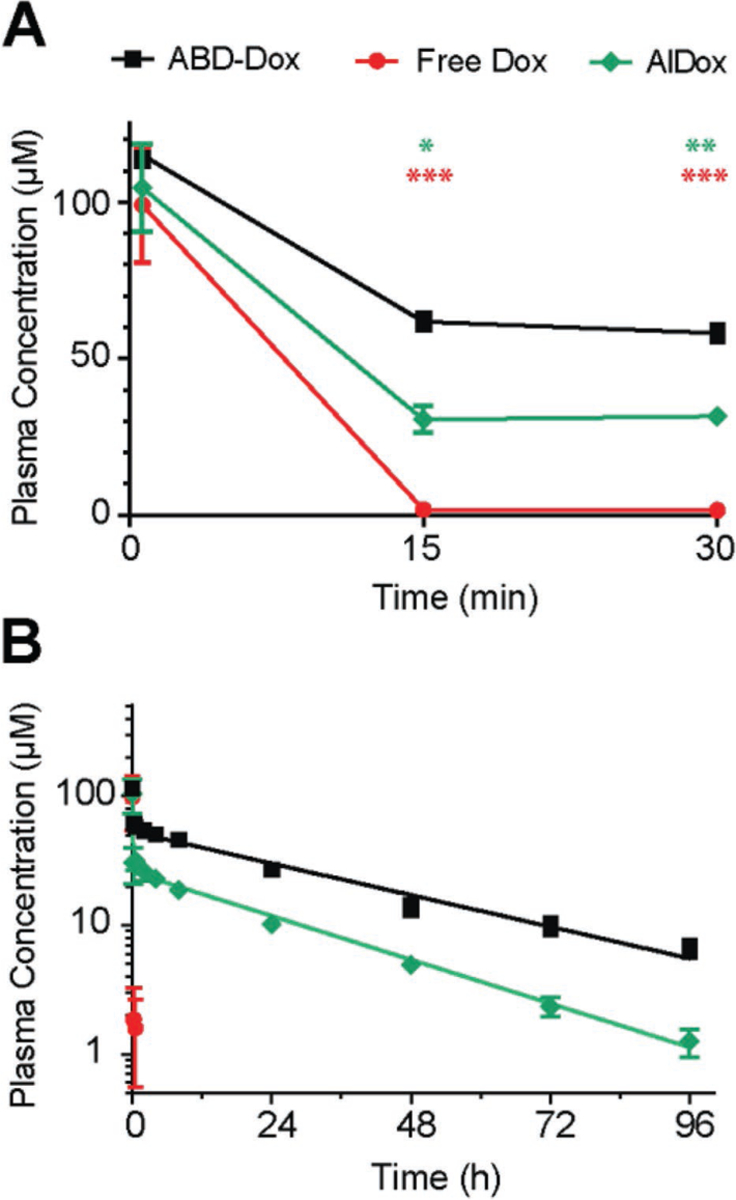
Pharmacokinetics of ABD–Dox. Plasma Dox concentration was measured over 96 h after administration of ABD–Dox via tail vein to BALB/c mice and fit to a two-compartment model from which the elimination half-life and the plasma drug exposure (area under the curve) were estimated, and are reported in Table 2: A) 0–30 min view; B) 0–96 h view. Data are presented as mean ± SEM, n = 5–6, one-way ANOVA and Tukey’s test, *P < 0.05, **P < 0.01, and ***P < 0.001.