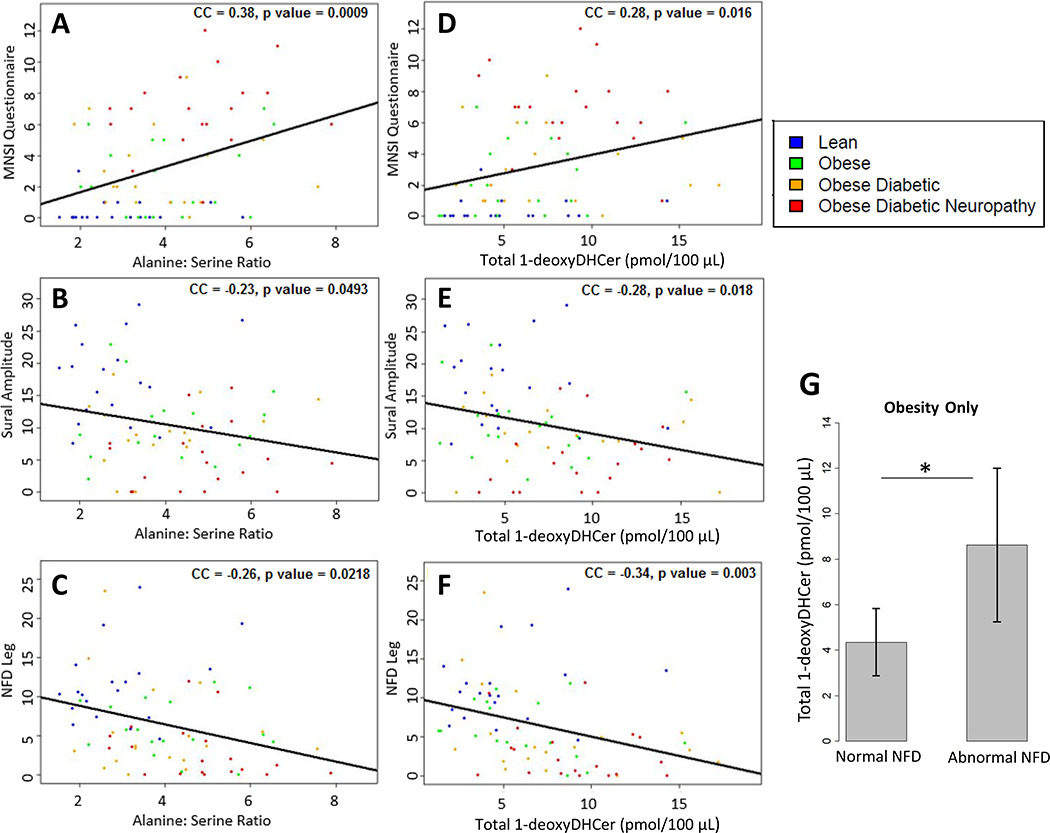
Fig. 3.
Plasma amino acid and 1-deoxydihydroceramide concentrations and DN severity (A–C) Correlation plots of alanine:serine with: (A) MNSI-Q (higher score denotes more severe DN), (B) sural nerve amplitude, and (C) leg NFD for lean (n = 19, blue), obese (n = 19, green), ob/T2D (n = 18, orange), and ob/T2D/DN (n = 19, red) subjects. (D–F) Correlation plots of total plasma 1-deoxydihydroceramide concentrations with: (D) MNSI-Q (E) sural nerve amplitude, and (F) leg NFD. (G) Comparison of 1-deoxydihydroceramide concentrations in participants with obesity only and normal versus abnormal NFD. *p < 0.05. 1-deoxyDHCer = 1-deoxydihydroceramides. NFD = nerve fiber density.

