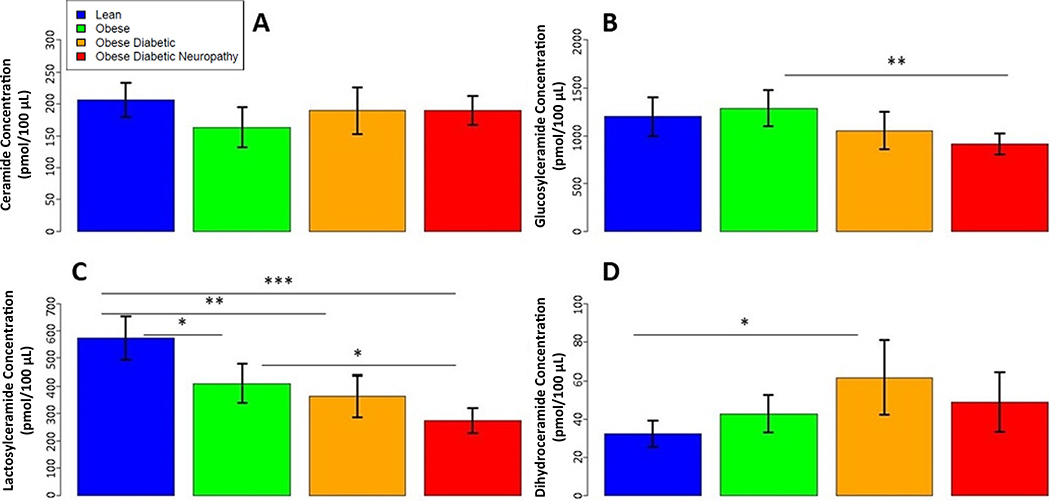
Fig. 4.
Plasma concentrations of typical ceramide species Quantification of plasma concentrations of: (A) total ceramides, (B) glucosylceramides, (C) lactosylceramides, and (D) dihydroceramides, in lean (n = 19, blue), obese (n = 19, green), ob/T2D (n = 18, orange), and ob/T2D/DN (n = 19, red). Values are expressed as mean ± SD. *p < 0.05, **p < 0.01, ***p < 0.001.

