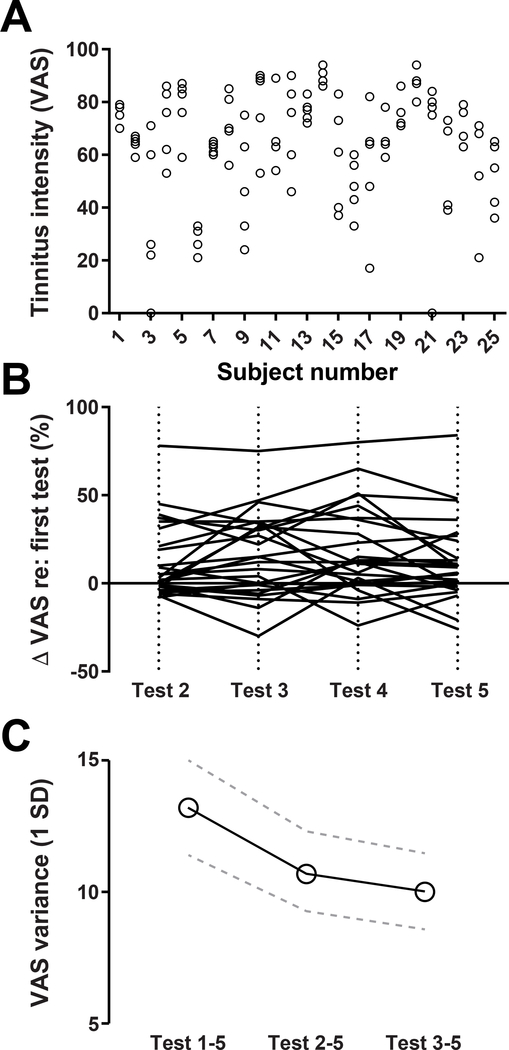
Figure 2.
Subjects rated their tinnitus intensity 5 times over a 2-week period on a visual analogue scale. A) Ratings within and between subjects were highly variable. Each circle represents a single VAS measurement per subject. B) The change in VAS relative to the first test are shown for tests 2–5. Individual subjects are represented by individual lines. C) The average variance (1SD) of VAS ratings decrease by dropping early test sessions. Error bars indicate standard error of the mean (SEM).

