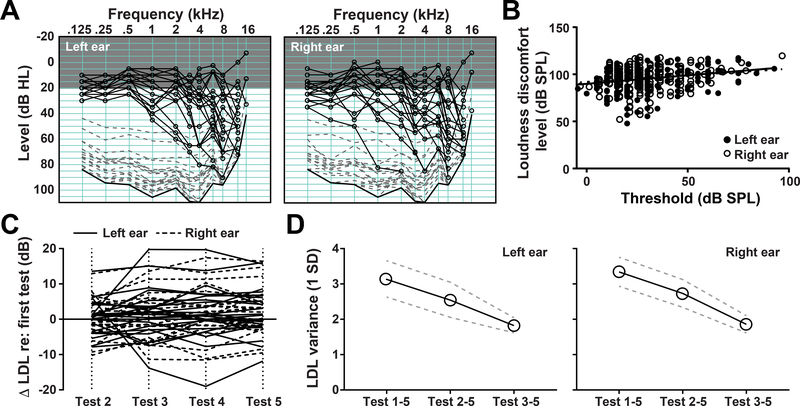
Figure 3.
A) Loudness discomfort levels were measured from the left and right ears with pure tone frequencies ranging from 125 Hz to 16 kHz (dashed gray lines). Tone detection thresholds (audiograms) are represented in black lines with round marks. Thick black line represents the output limit of the equipment. Gray shaded region represents the range of normal hearing thresholds. Data reflect measurements from each subject at the first test session. B) Loudness discomfort thresholds increase with threshold, but the change is not proportionate, resulting in a reduced comfortable listening range with increasing audibility thresholds. Black line represents the linear fit to the data. C) Loudness discomfort levels measured five times over a 2-week period. The change in LDL relative to the first measurement are shown for tests 2–5. Individual subjects are represented by individual lines. D) The average variance (1SD) of loudness discomfort level measured in the left and right ears is reduced by dropping the first test session.

