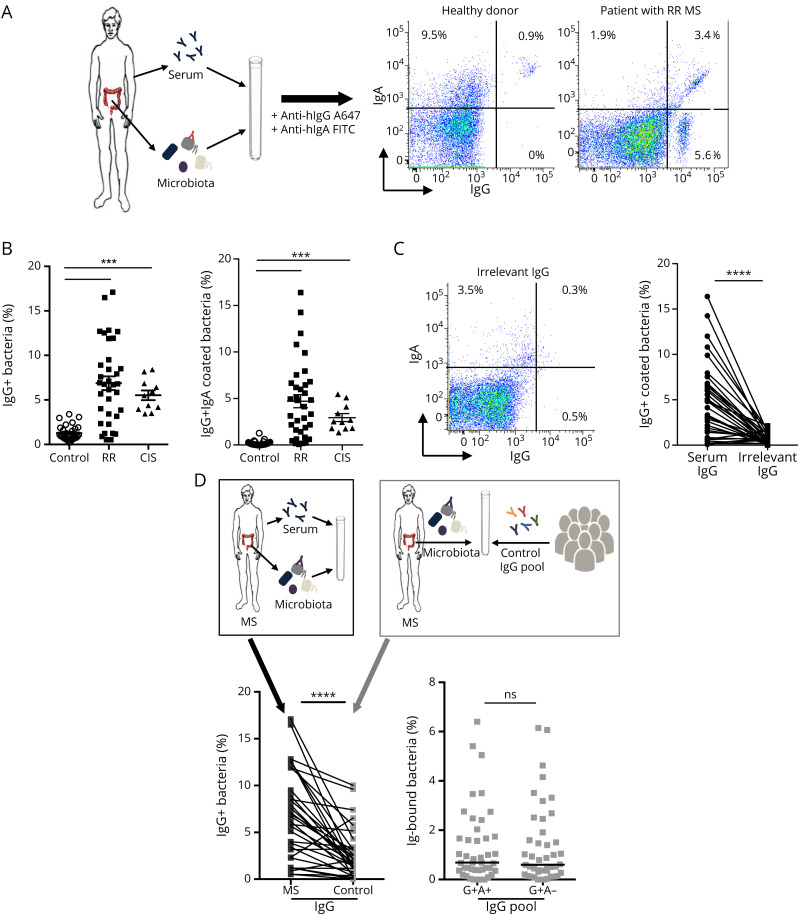
Figure 2. Enhanced IgG Antimicrobiota Response in Patients With MS.
(A) Procedure (top) and representative flow cytometry detection (bottom) of endogenous secretory IgA and autologous systemic IgG (10 μg/mL) coating on healthy or RR-MS fecal microbiota is presented (middle panels). (B) Proportions of IgG+IgA± (left) and IgG+IgA− (right) coated bacteria are compared in healthy donors (n = 30), patients with RR-MS (n = 32), or patients with CIS (n = 12). Median values are indicated. p Values were calculated using the nonparametric Mann-Whitney test (***p < 0.001). (C) Representative flow cytometry dot plot (left) and analysis (right) of irrelevant IgG (anti-TNFα 10 μg/mL) binding to RR-MS and CIS fecal microbiota (n = 44). (D) Procedure (top), representative flow cytometry dot plot (middle panel) and analysis (bottom) of autologous IgG or pooled healthy IgG binding to RR-MS fecal microbiota (n = 32). Proportions of IgG+IgA± coated bacteria (bottom left), IgG+IgA+ and IgG+IgA− coated bacteria (bottom right) are shown. p Value was calculated by using the Wilcoxon paired test (****p < 0.0001; ns = nonsignificant). CIS = clinically isolated syndrome; MS = multiple sclerosis; RR = relapsing-remitting.

