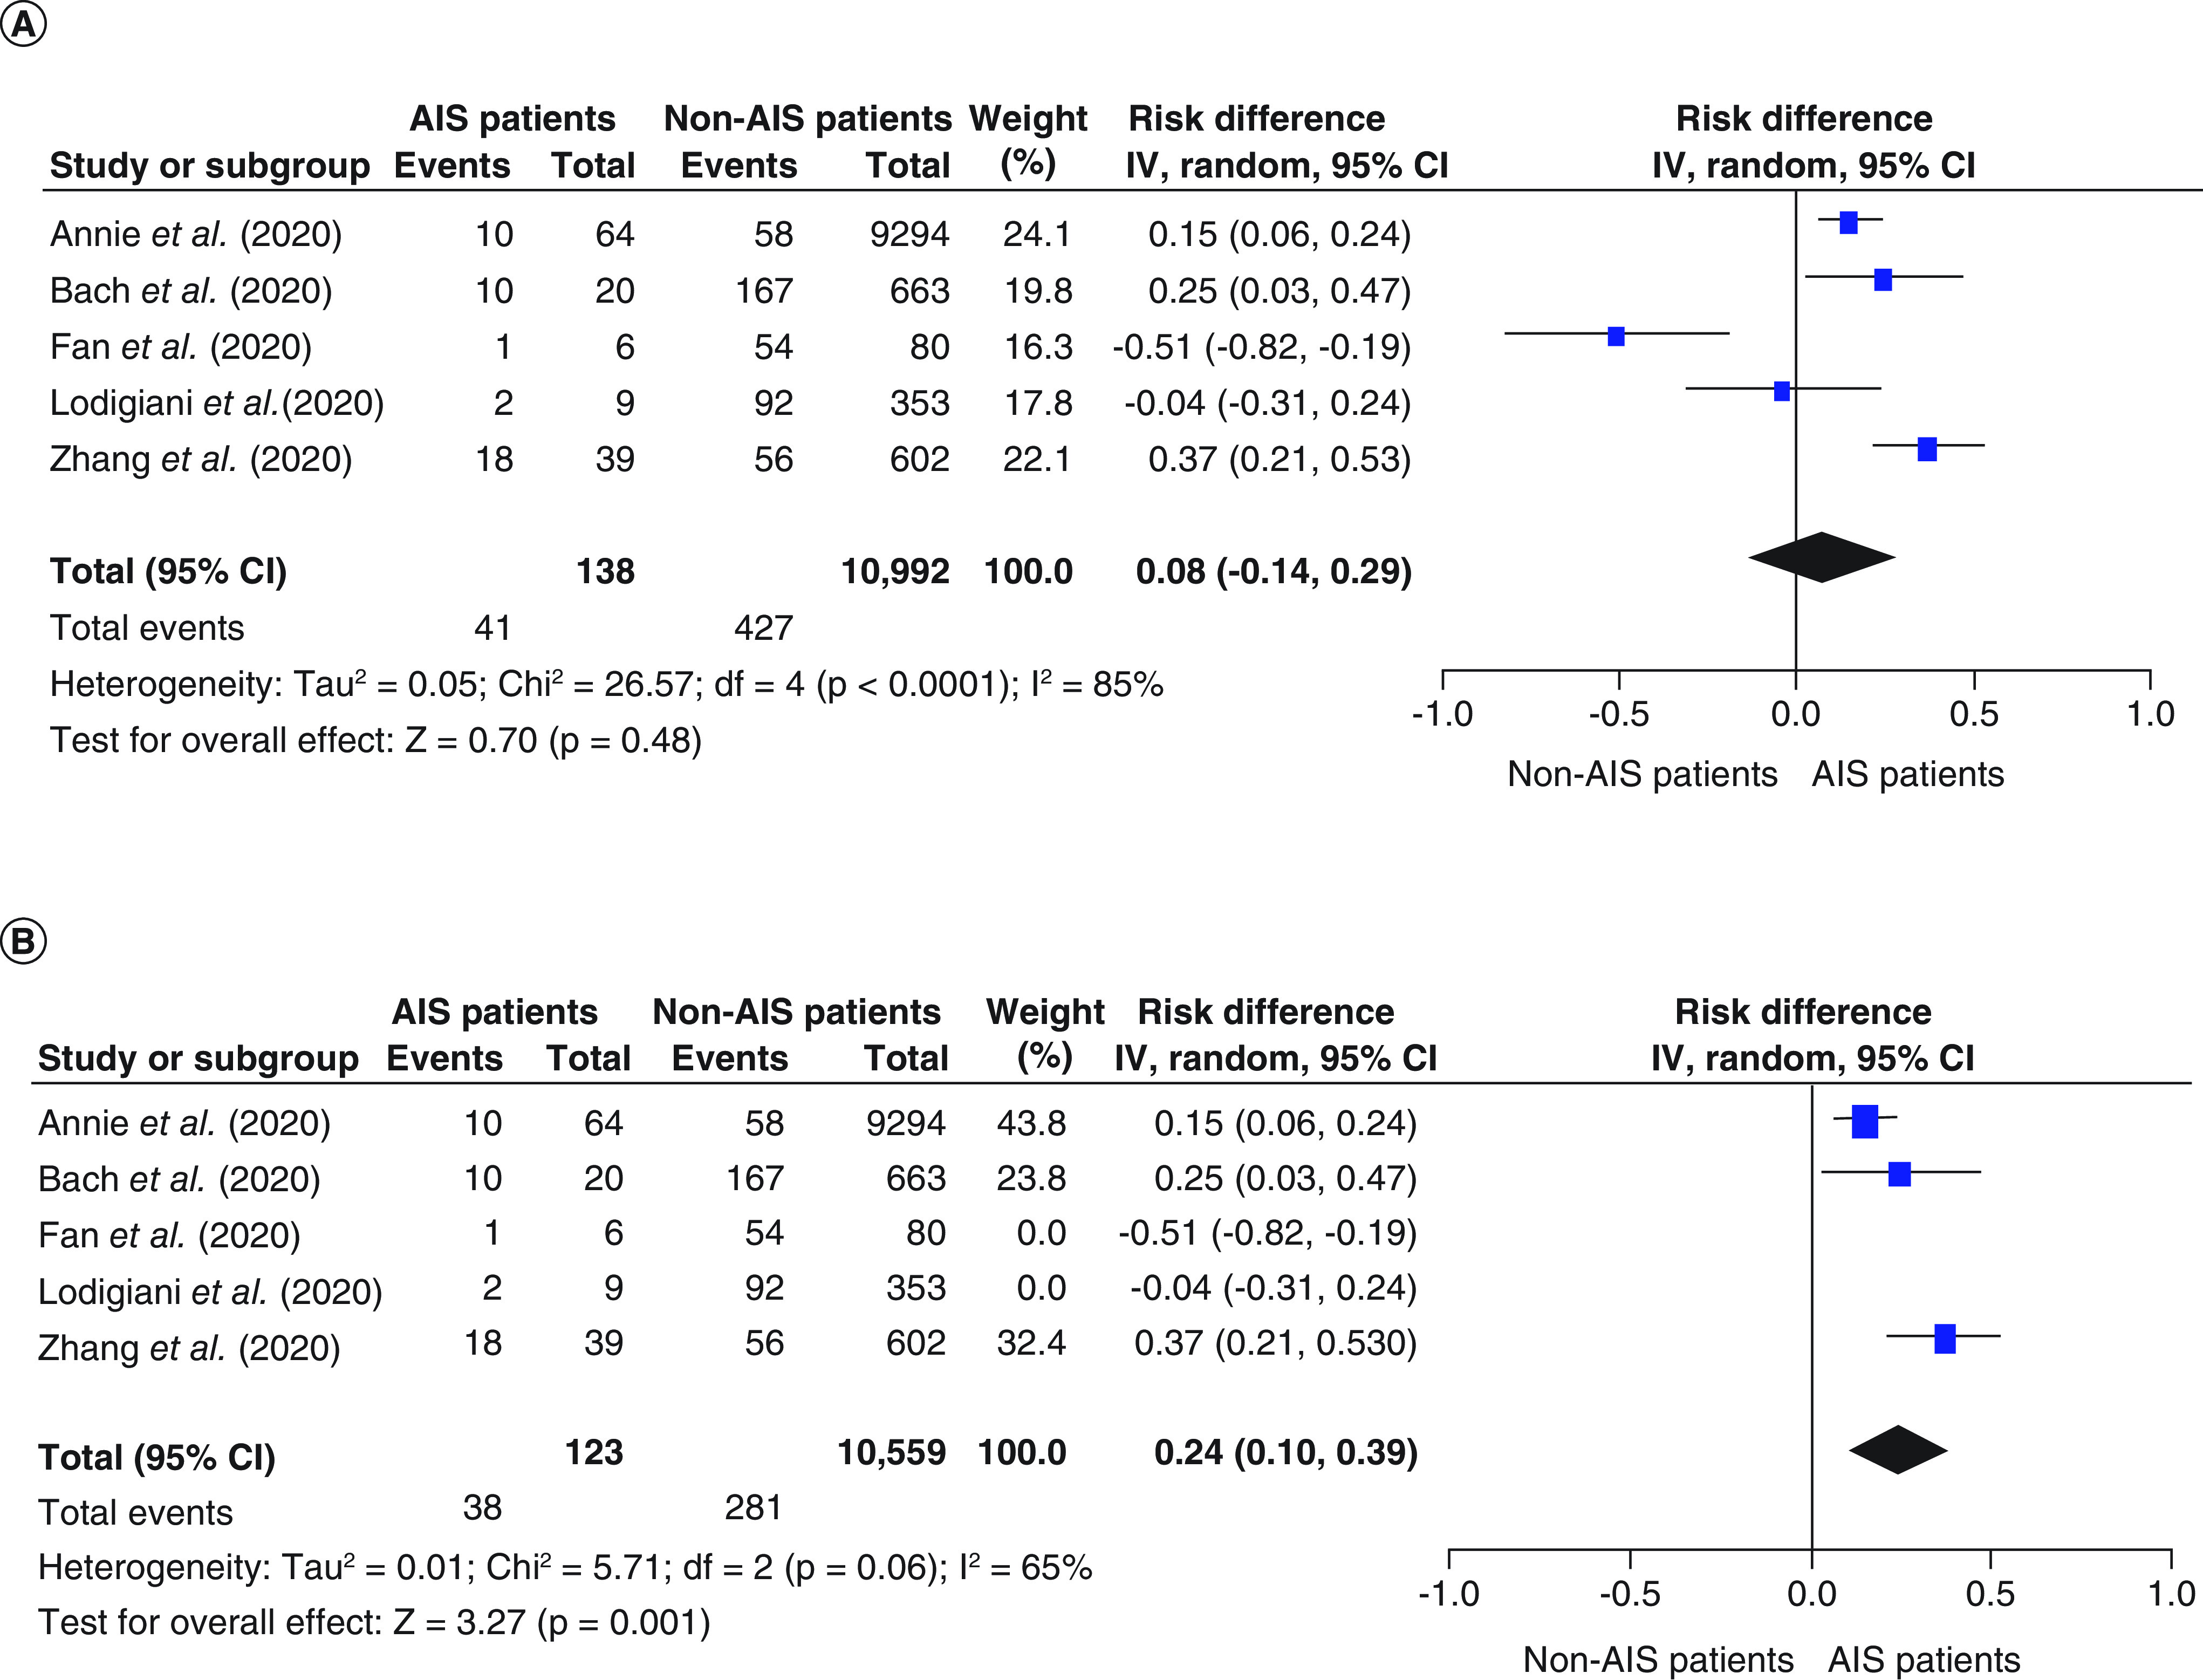
Figure 2. . The forest plot of the risk difference in mortality and the corresponding 95% CIs (right graph area suggests higher mortality in the COVID-19 with AIS group).

AIS: Acute ischemic stroke; df: Degrees of freedom.

AIS: Acute ischemic stroke; df: Degrees of freedom.