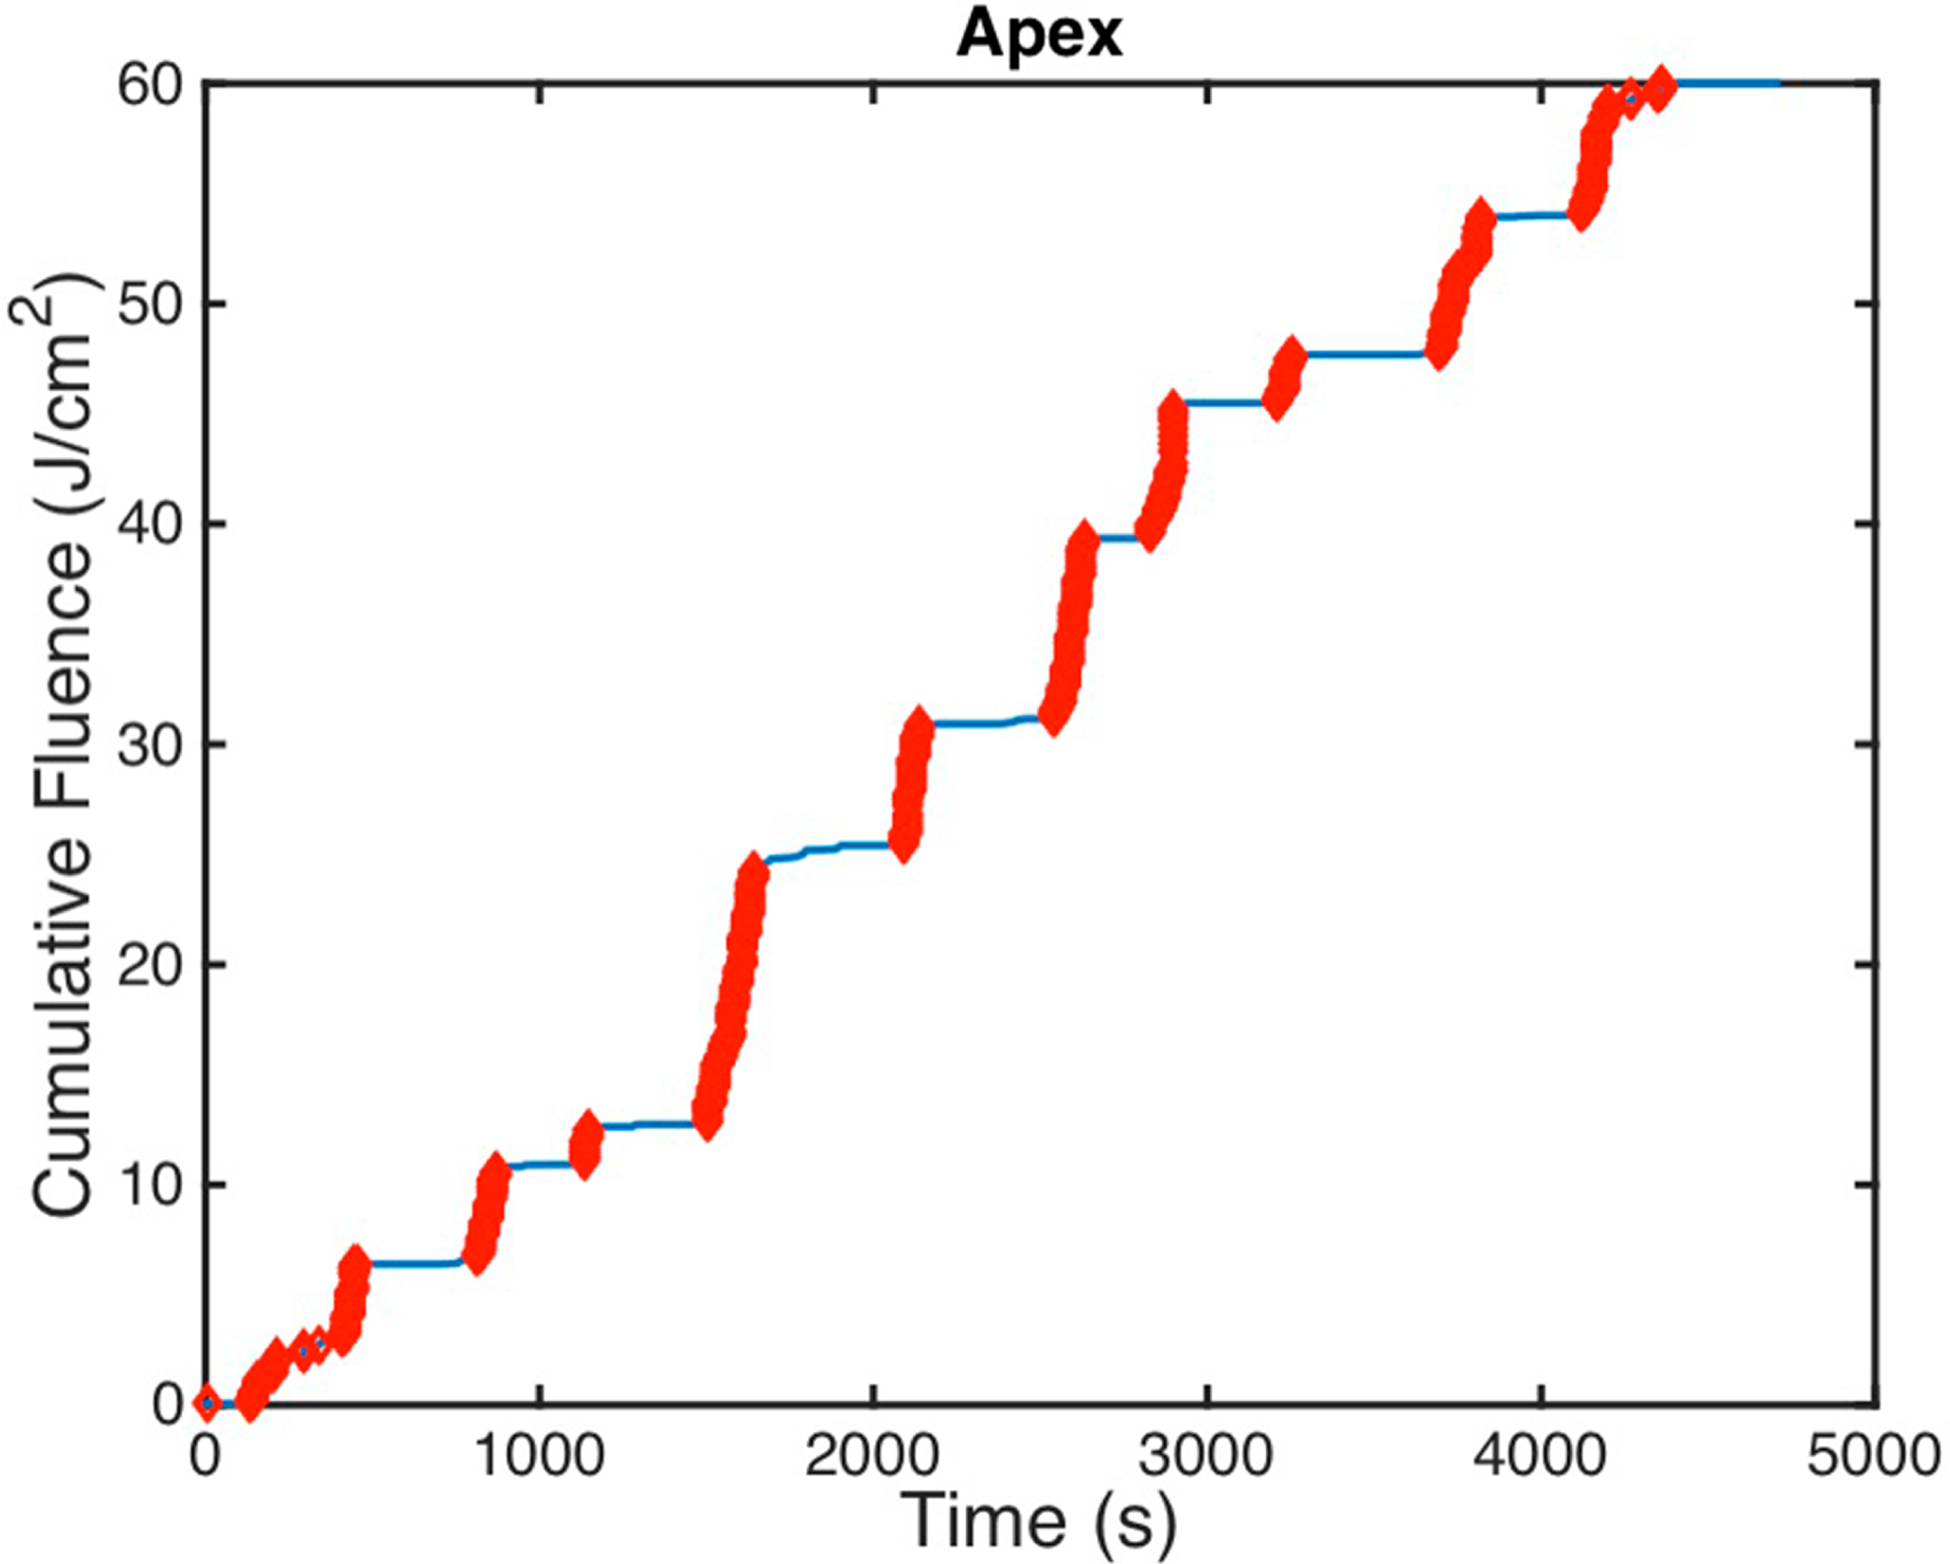
Figure 3.

Measured cumulative fluence is shown for patient case 020 at the paex detector with regions highlighted in thick red that display ‘features.’ These features were used to determine the time stamps that are indicative of the treatment wand location being near that particular detector.
