
Figure 6.
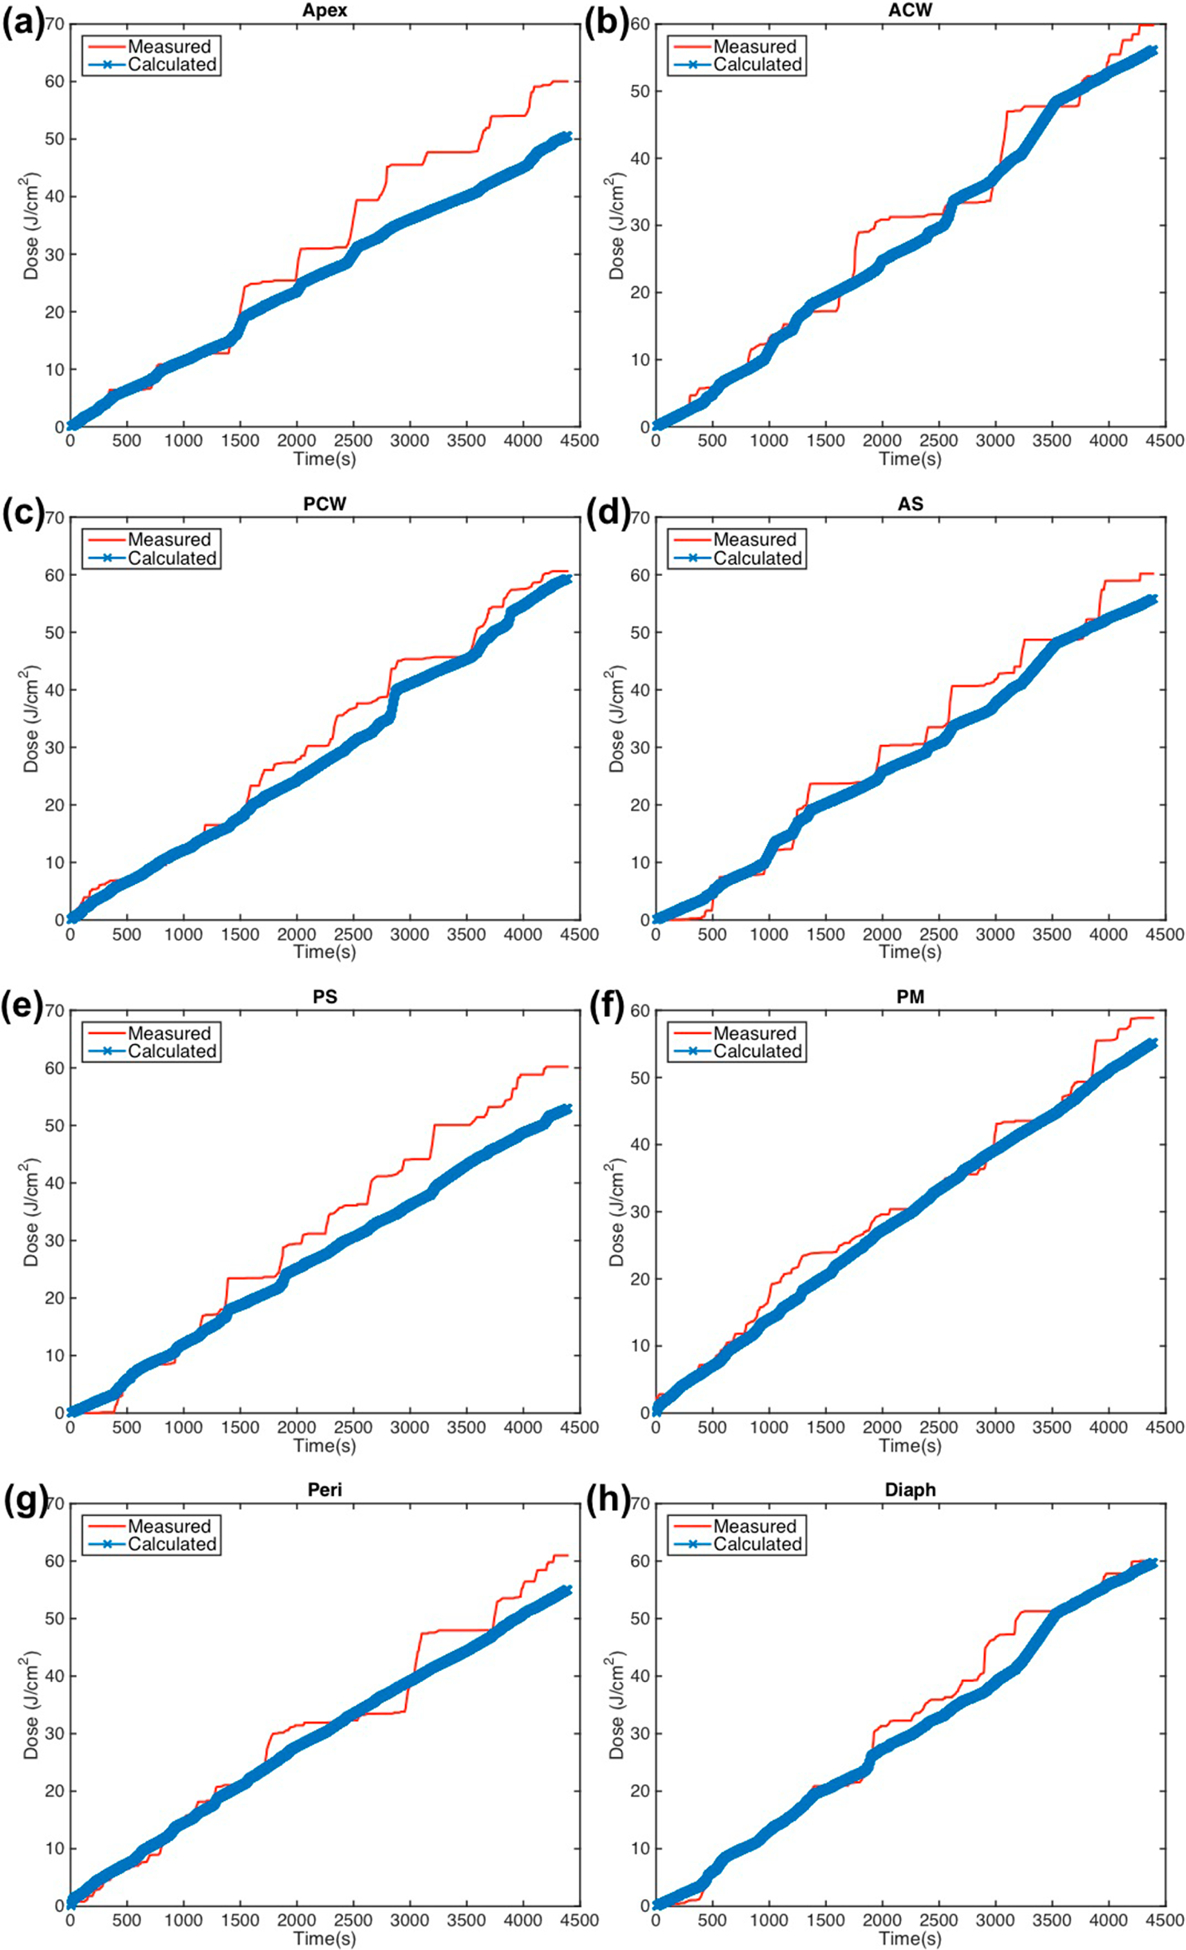
Measured (red solid line) light fluence data over the course of treatment along with calculated (blue ‘x’) light fluence using the primary component with fixed scattered light (equation (2)) plotted for eight detector locations: (a) apex (b) anterior chest wall (c) posterior chest wall (d) anterior sulcus (e) posterior sulcus (f) posterior mediastinum (g) pericardium (h) diaphragm.