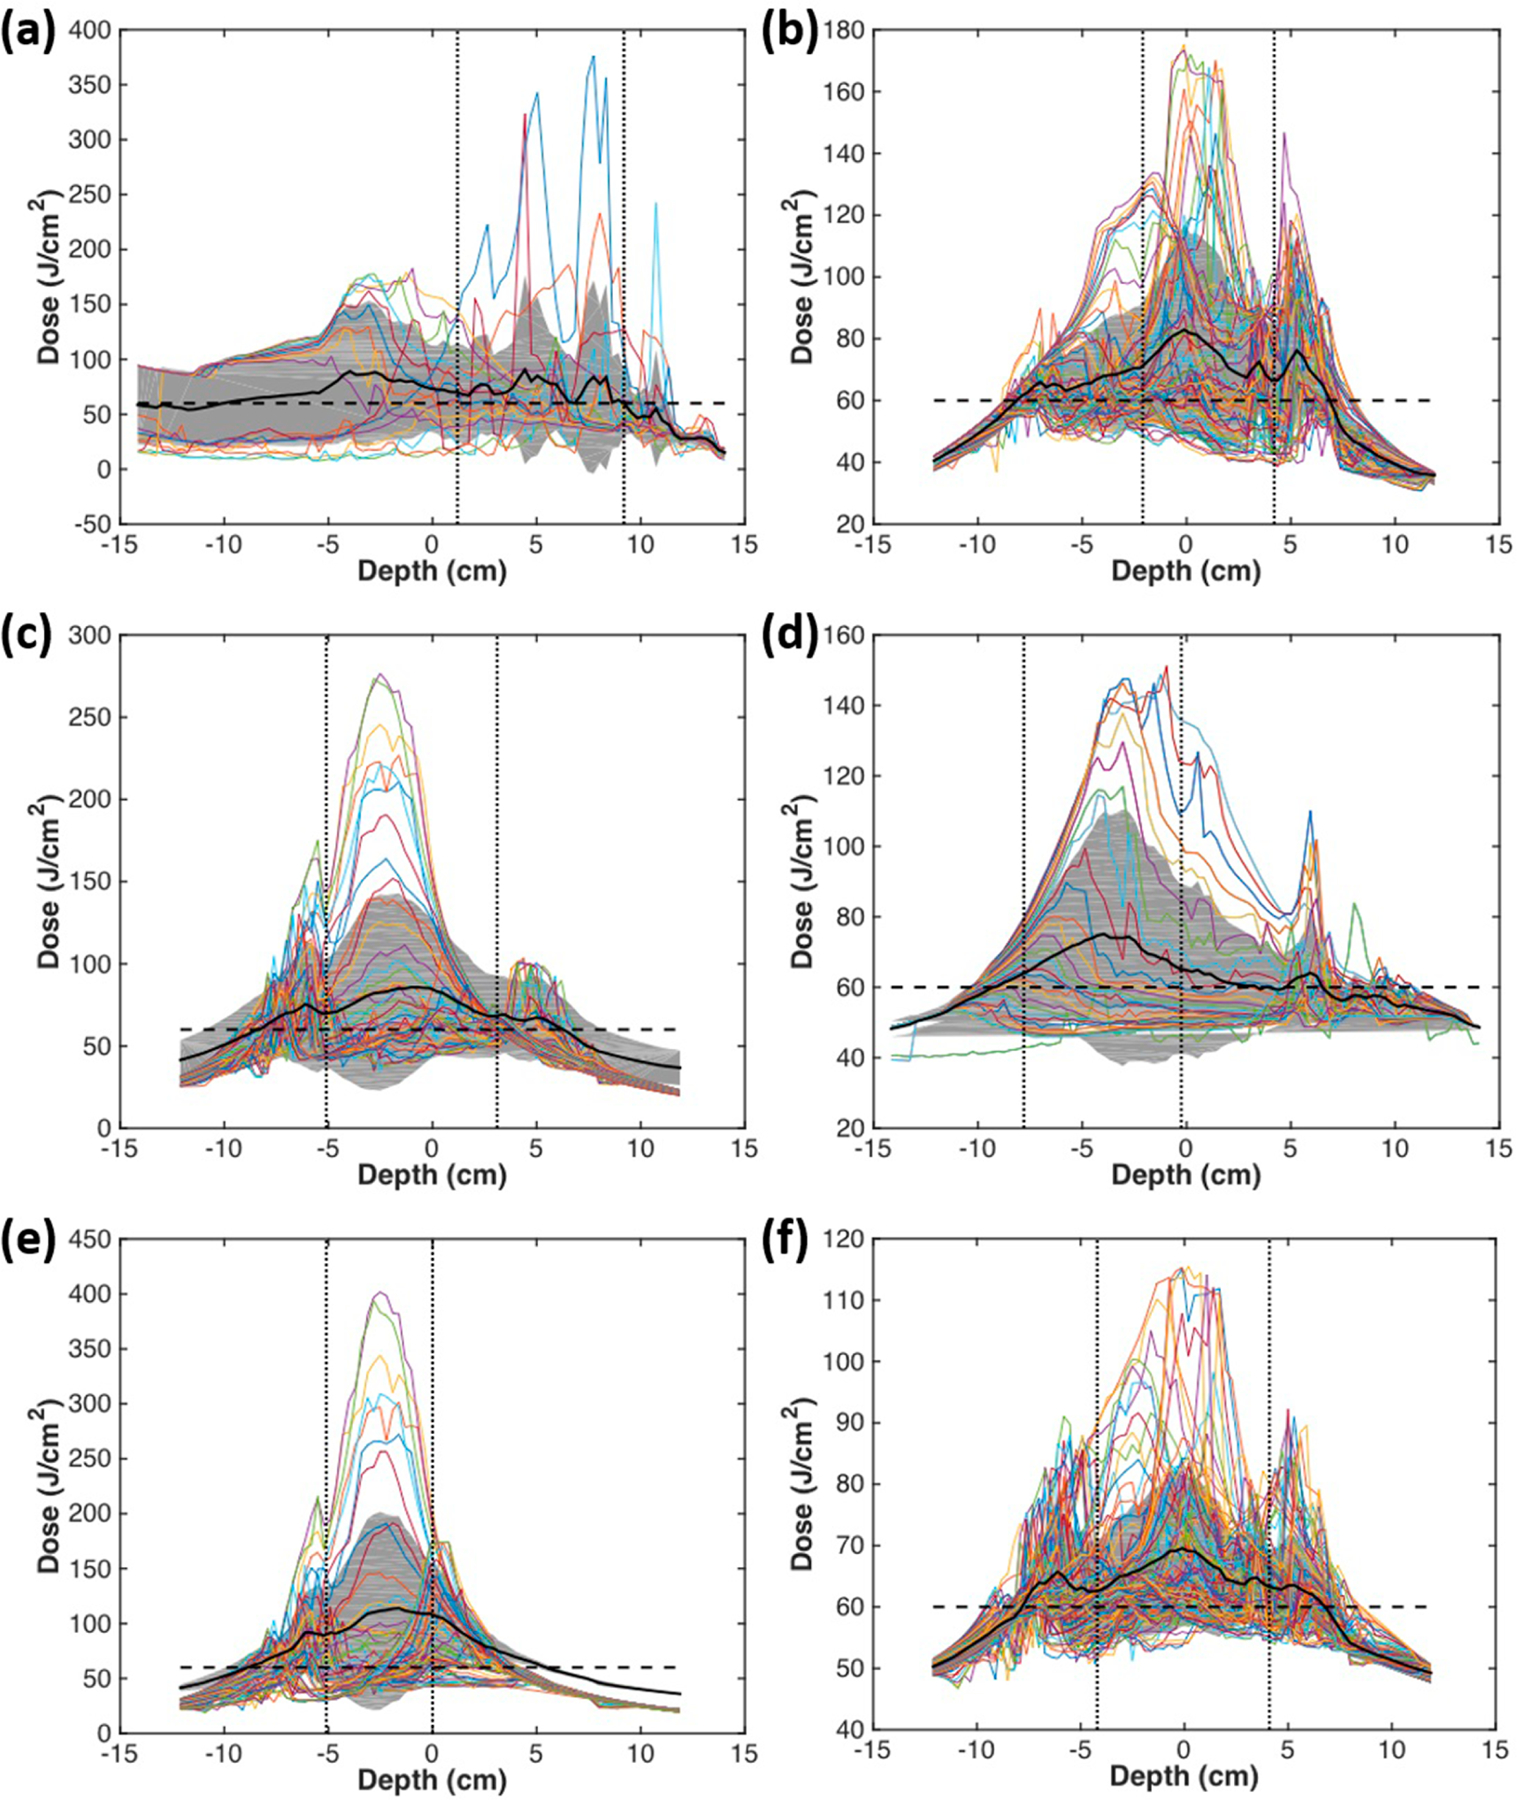
Figure 9.

Fluence distribution along the z-axis (depth) for each angular location. The mean is shown in a solid black line, and the grey area indicates the standard deviation. The horizontal dashed line indicates the prescription light dose of 60 J cm−2. Uniformity is calculated as percent variation and summarized for each patient in table 5, excluding the region corresponding to the surgical opening, outlined by the vertical dotted lines. (a)–(f) indicate cases numbers 012, 014, 016, 017, 018, 020, respectively.
