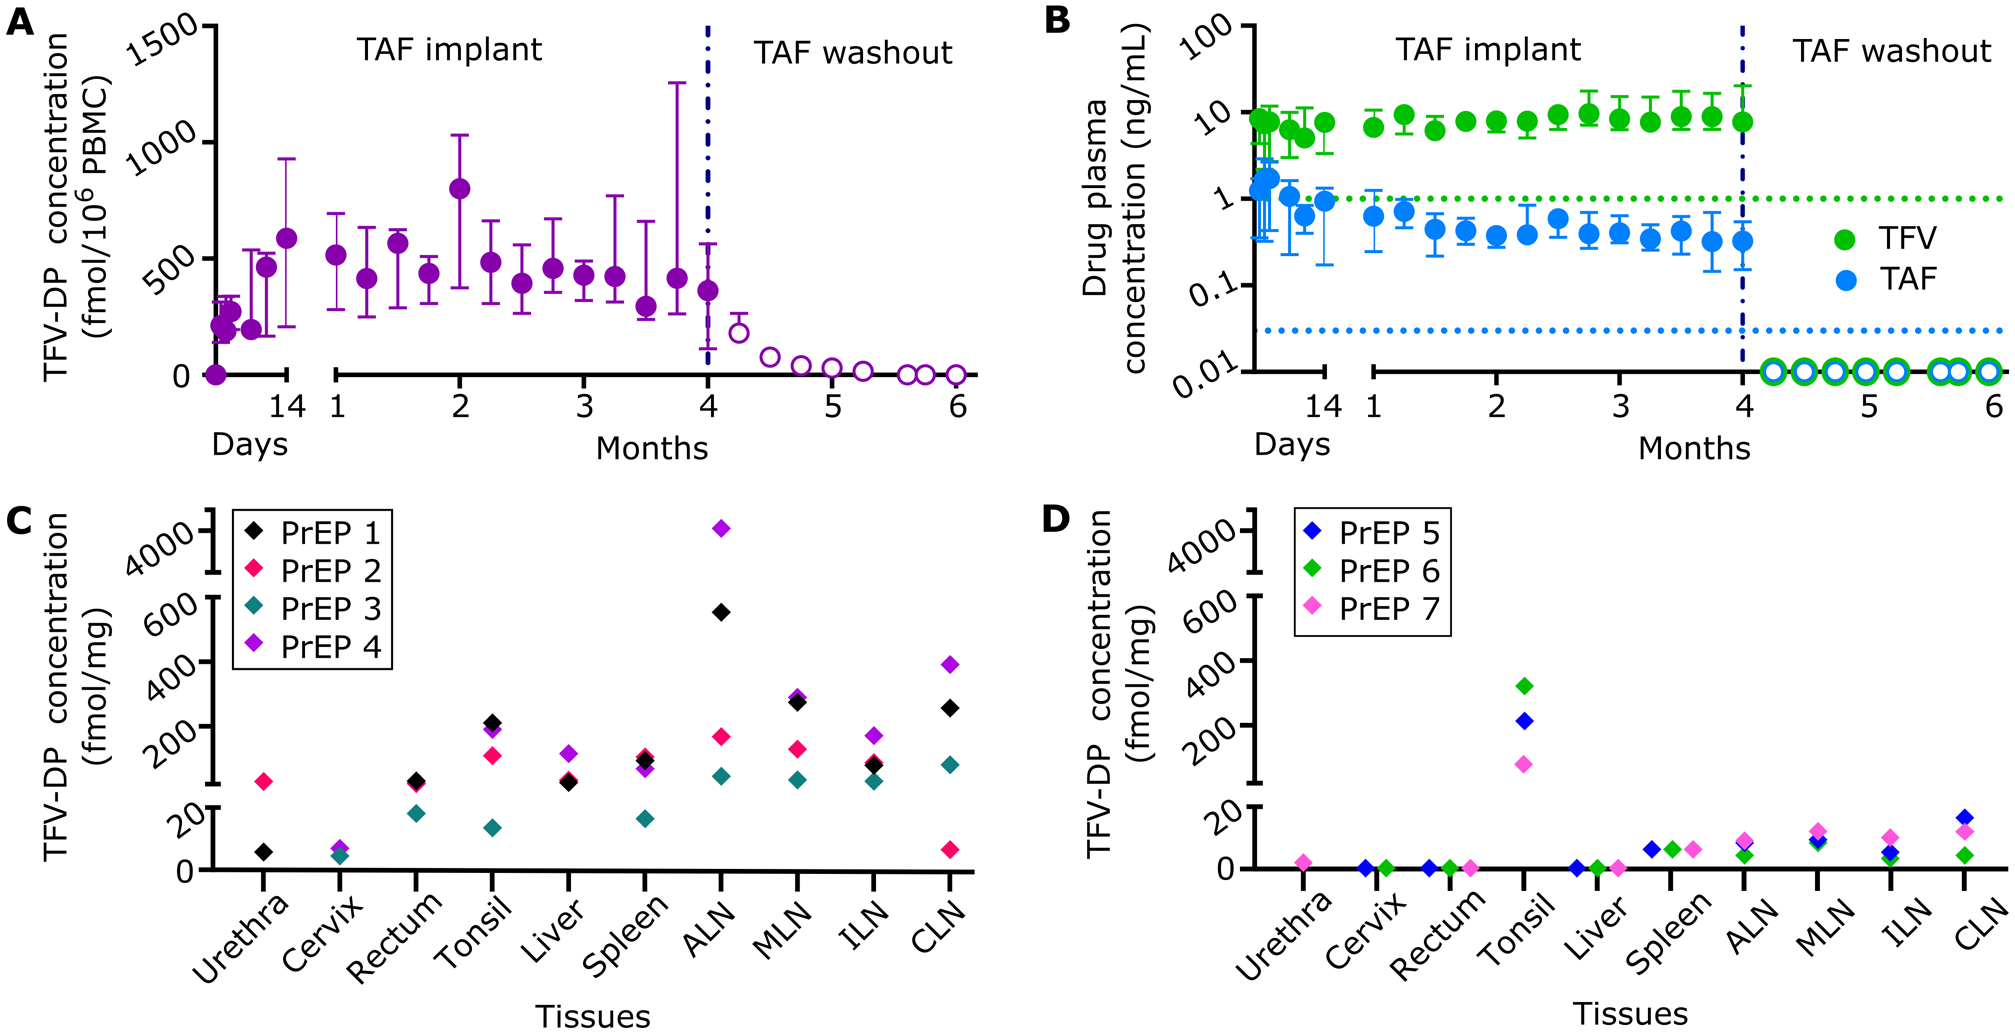
Figure 2.

Pharmacokinetics and tissue distribution of TAF from PrEP group implanted with subcutaneous nTAF. nTAF implants (n=7) were retrieved after 4 months and washout concentrations (open circles) were followed in 3 animals. A) Intracellular TFV-DP PBMC concentrations of PrEP cohort throughout the study. B) TAF and TFV concentrations in the plasma of PrEP cohort throughout the study. Green and blue dotted horizontal lines represent lower LOQ TFV and TAF concentrations, 1.00 ng/mL and 0.03 ng/mL, respectively. C) Tissue TFV-DP concentrations upon nTAF removal after 4 months of implantation in a subset of animals (n=4). D) Tissue TFV-DP levels after the 2-month washout period in a subset of animals (n=3). Data are presented as median ± IQR in panels A and B.
