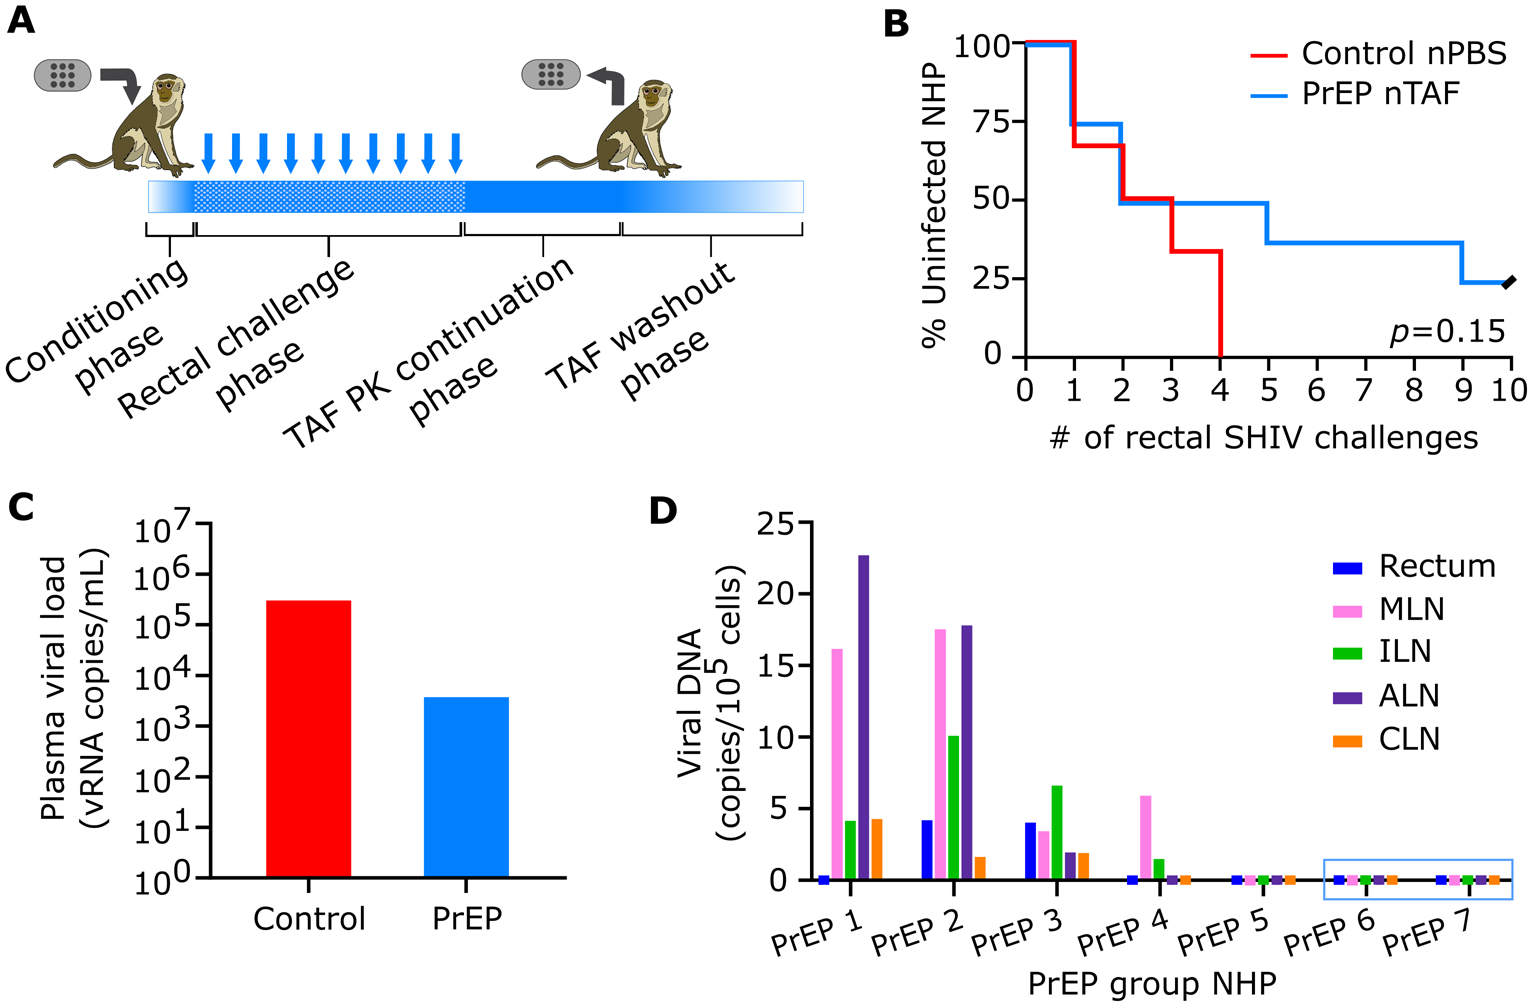
Figure 3.

PrEP efficacy of nTAF. A) Schematic of study design. Conditioning phase to reach TFV-DP PBMC concentrations above 100 fmol/106 cells. Rectal challenge phase with up to 10 weekly low-dose SHIVSF162P3 exposures. TAF PK continuation phase followed by nTAF explantation from all animals and euthanasia of 4 animals. TAF washout was observed in the remaining 3 animals for 2 months prior to euthanasia. B) Kaplan-Meier curve representing the percentage of infected animals as a function of weekly SHIV exposure. PrEP (n=8) vs control (n=6) group; censored animals represented with black slash. Statistical analysis by Mantel-Cox test. C) Median peak viremia levels in breakthrough animals at initial viral load detection. D) Cell-associated viral DNA loads of tissues in PrEP group. Animals PrEP 1–5 were infected while PrEP 6 and 7 (blue box) remained uninfected throughout the study. MLN, mesenteric lymph nodes, ILN, inguinal lymph nodes, ALN, axillary lymph nodes, CLN, cervical lymph nodes.
