
Figure 3. Model Estimates of the Magnitude of Race Differences in Grades by School Poverty.
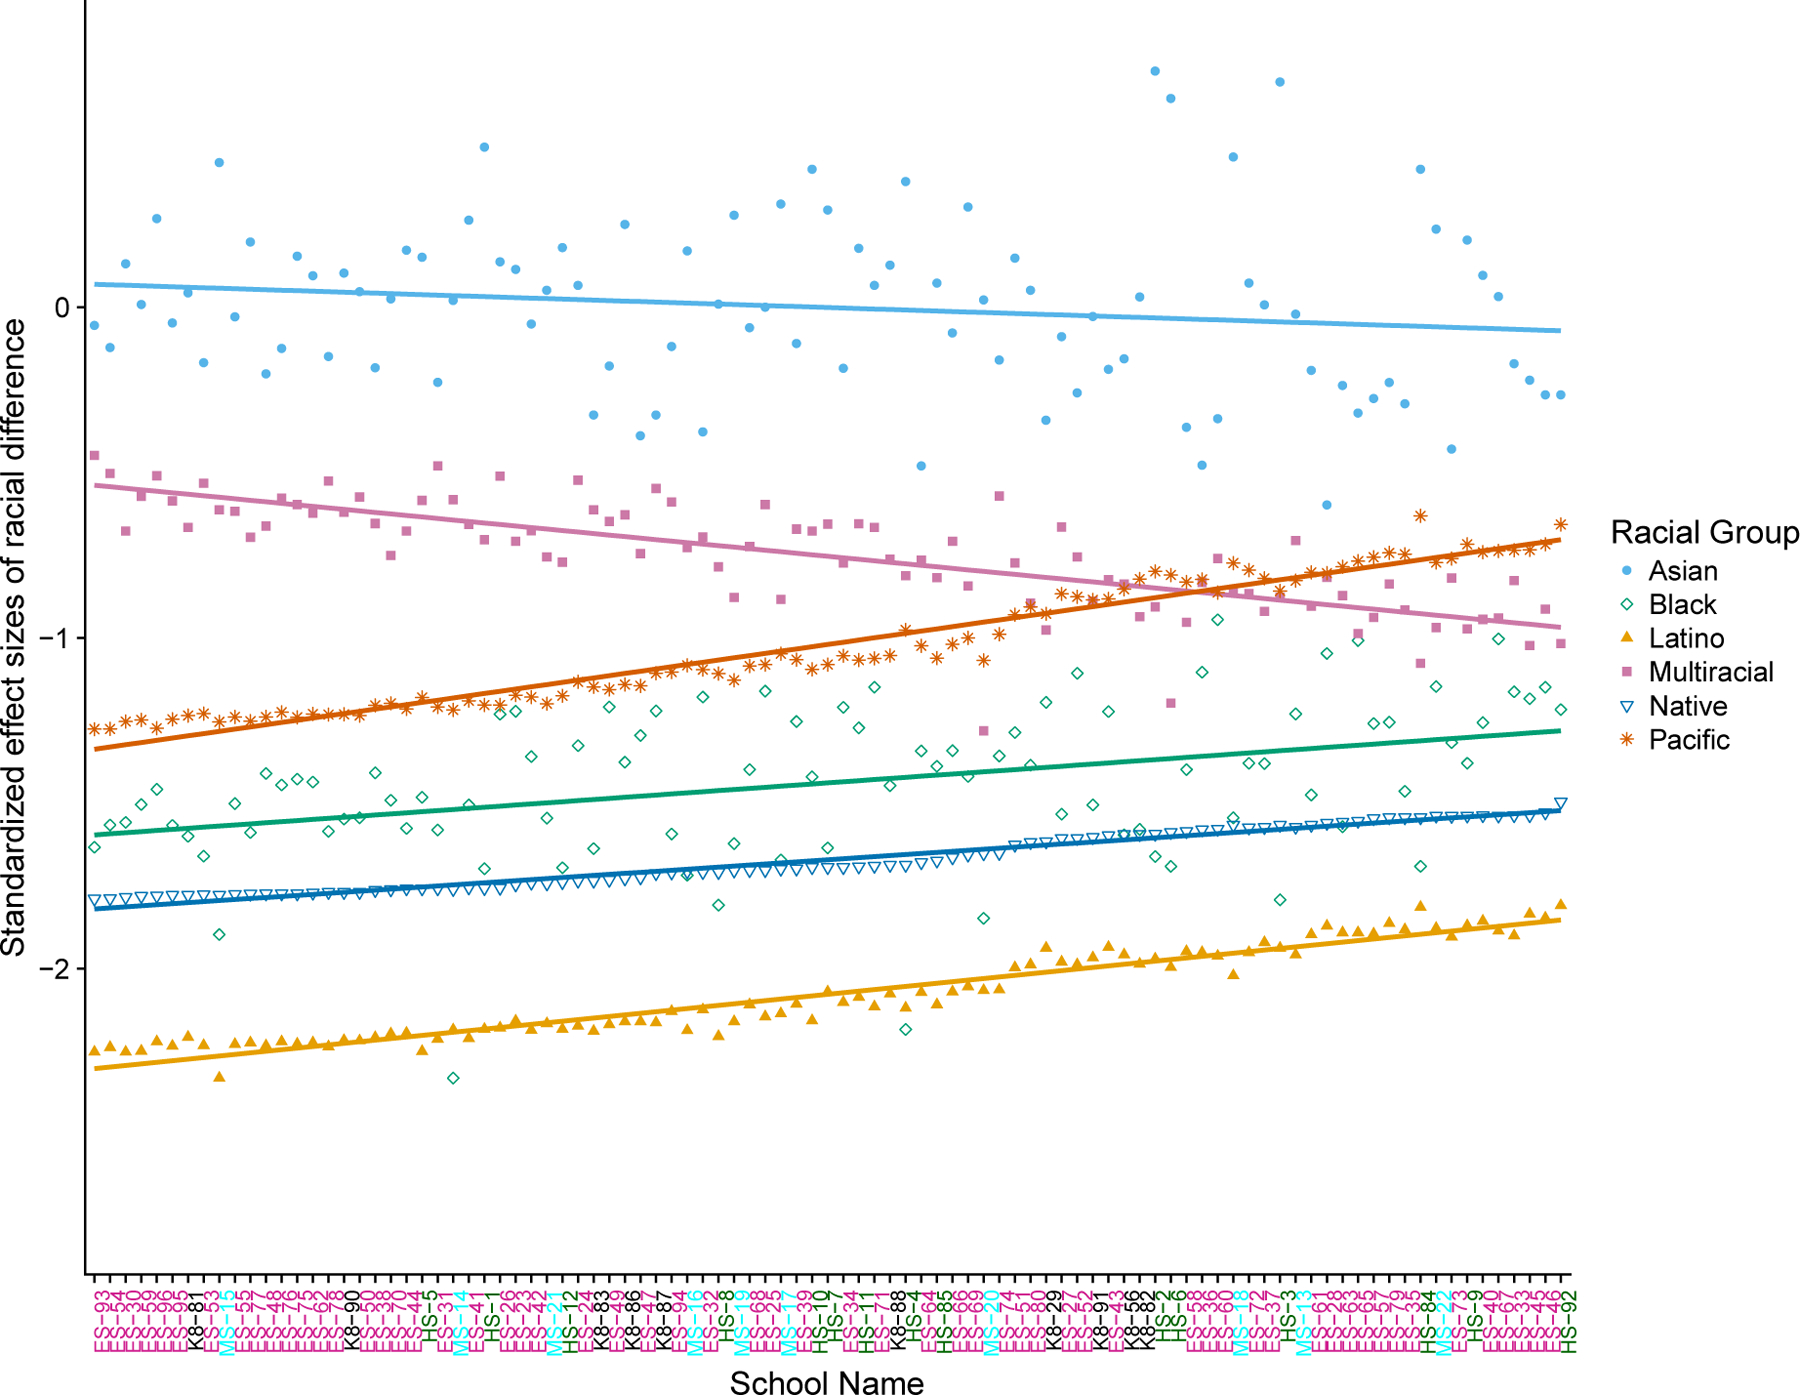
Note: Highest school poverty on the left to lowest school poverty on the right, in standard deviation units. The intercept is significant for all groups except Asian students, the slope is significant for all groups except Asian and Black students. ES=Elementary School (pink), MS=Middle School (Blue), HS=High School (Green), K8=K8 School (Black).