
Figure 2.
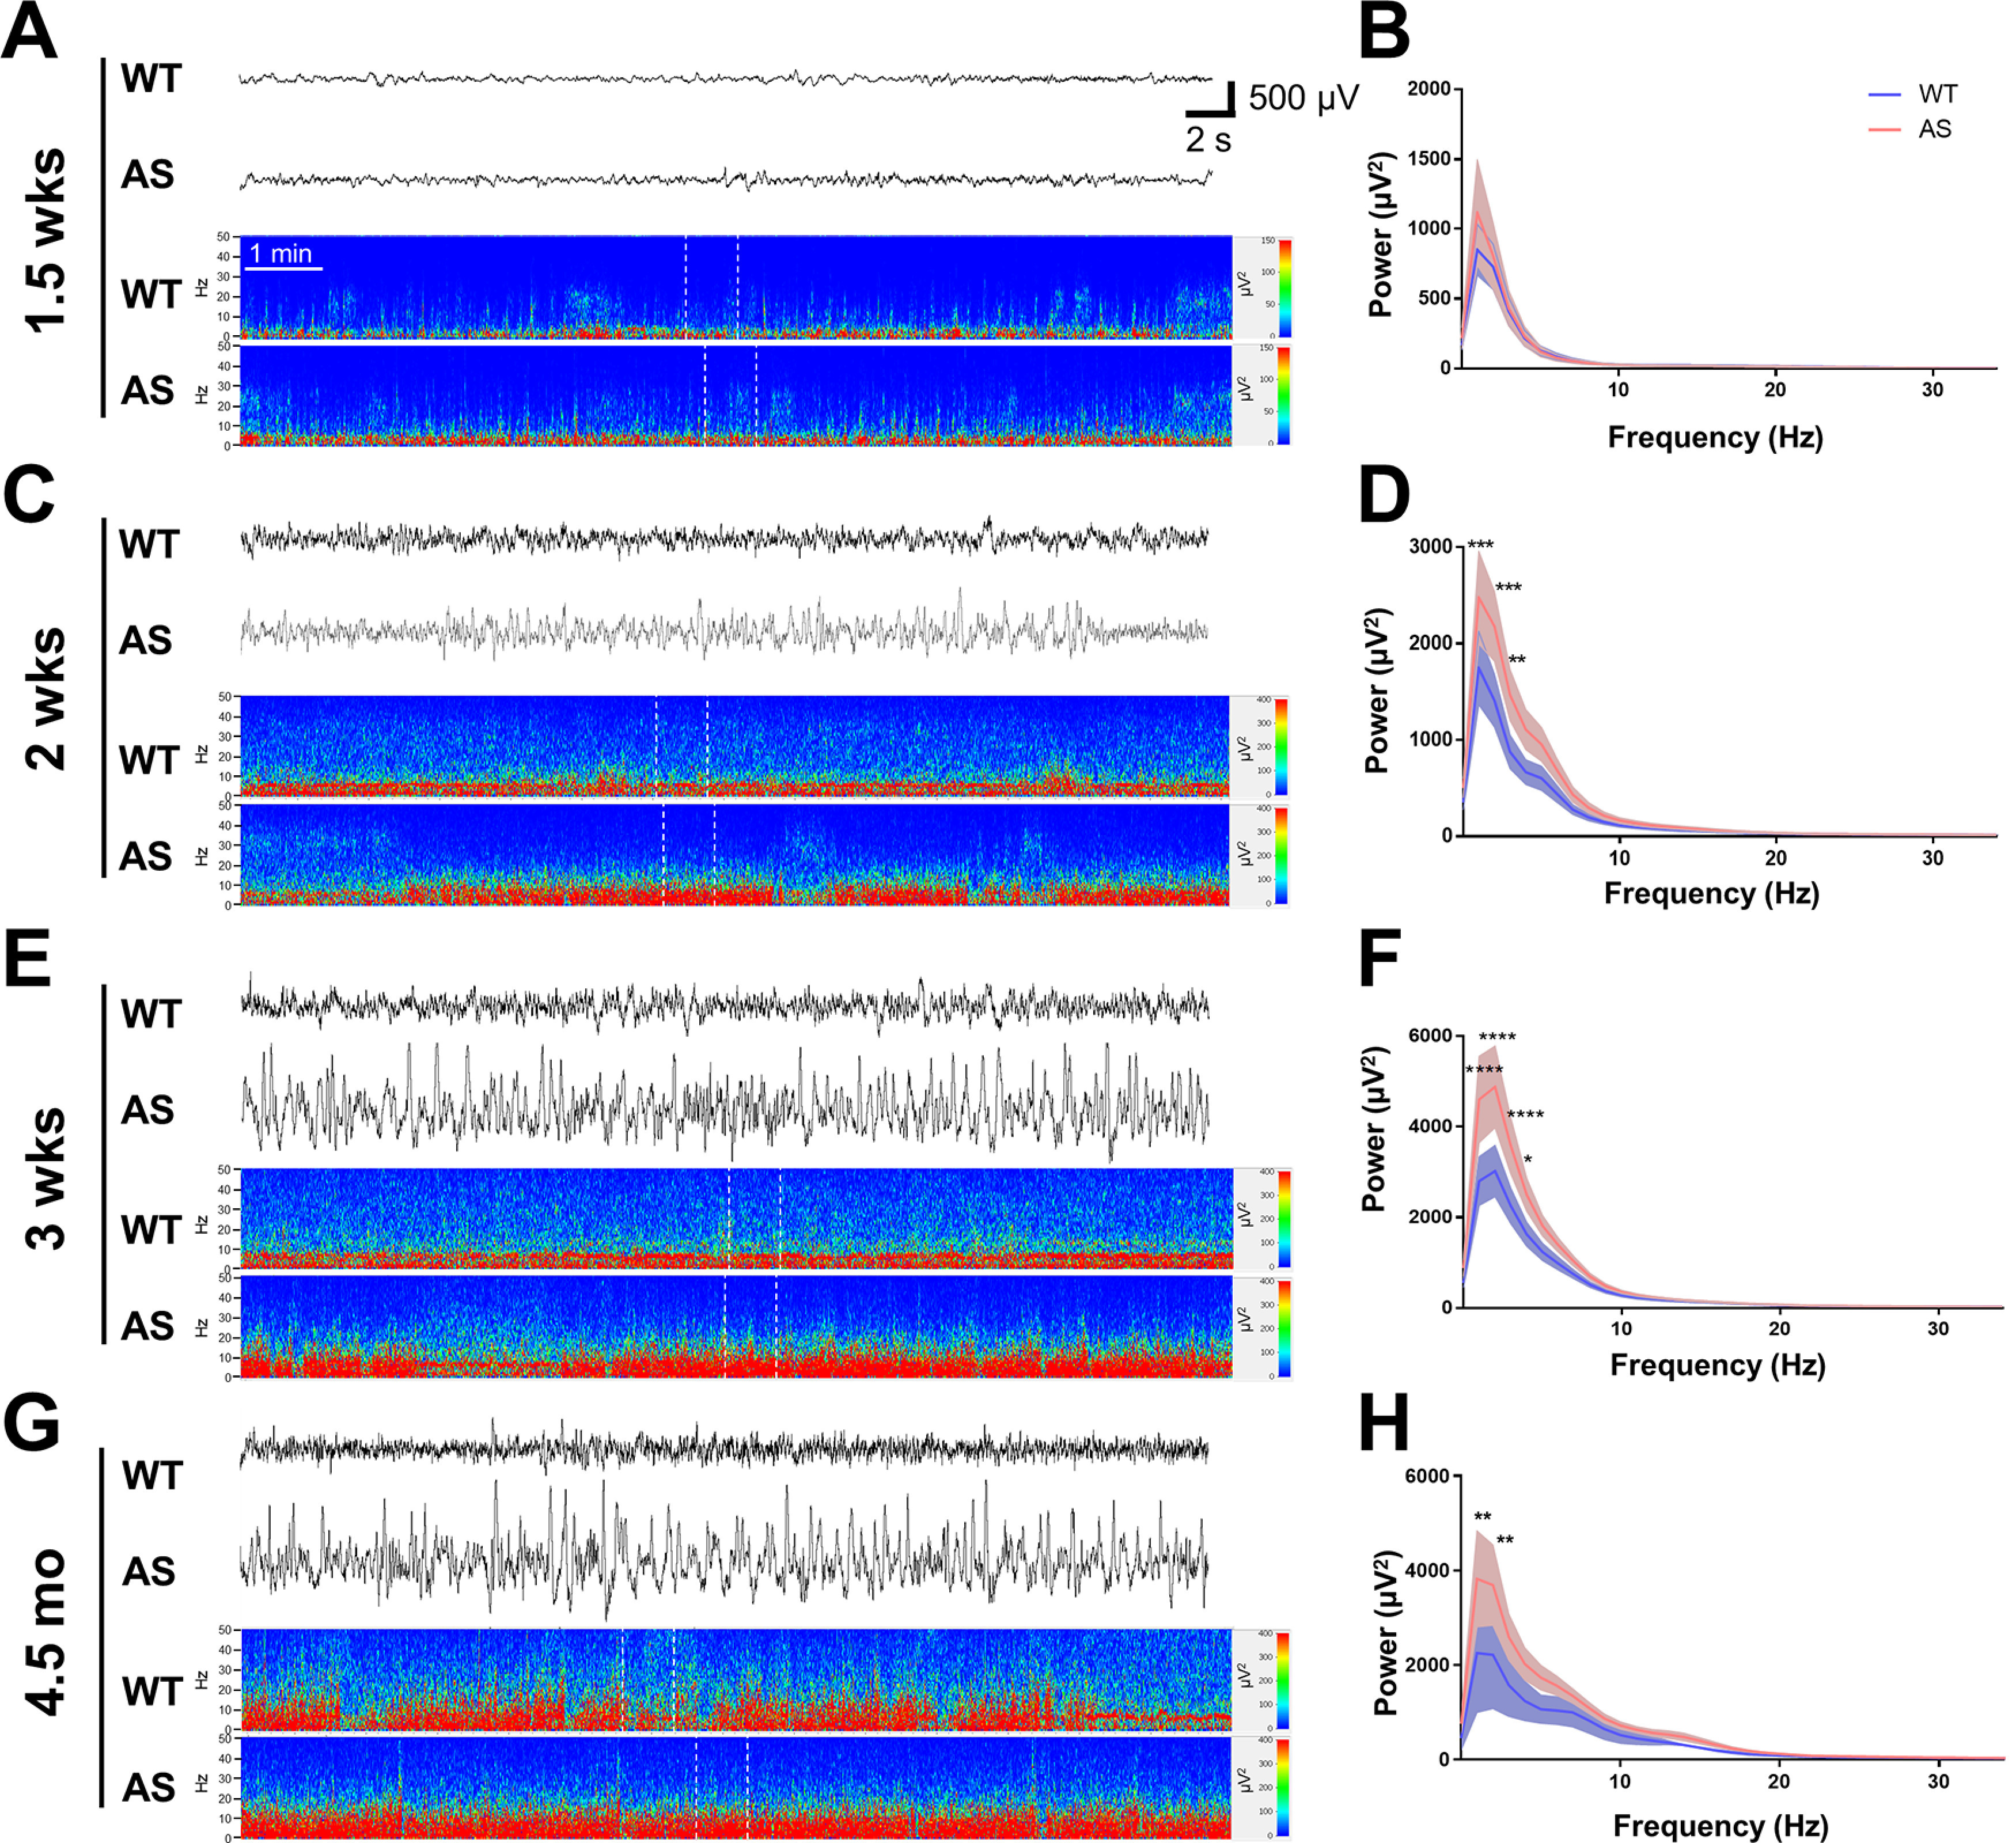
Characterization of hippocampal EEG activity during the light cycle from early development into adulthood. A, C, E, G, Hippocampal EEG traces and power spectra show representative activity from neonates, juveniles, and adult WT and AS rats (with the corresponding EEG activity segment indicated by white dotted lines in each spectrogram), while B, D, F, H show the age-matched quantification of activity from representative epochs during light cycle activity. A, B, Representative EEG activity and spectral power analysis from 1.5-week-old WT and AS rats show discontinuous activity and spectral power analysis from epochs of continuous activity shows no significant difference in power spectra in the WT and AS rats (n = 9). C, D, Representative EEG activity and spectral power analysis at two weeks of age show increased δ power in AS compared with WT rats (n = 7–10; p < 0.001 at 1–2 Hz, p < 0.01 at 3 Hz). E, F, Representative EEG activity and spectral power analysis at three weeks of age show an increase in δ power in AS compared with WT rats (n = 7–12; p < 0.001 at 1–3 Hz, p < 0.05 at 4 Hz). G, H, Representative EEG activity and spectral power analysis show the persistence of increased δ power in adult AS compared with WT rats (n = 3–6; p < 0.01 at 1–2 Hz); *p < 0.05, **p < 0.01, ***p < 0.001, ****p < 0.0001.