
Figure 5.
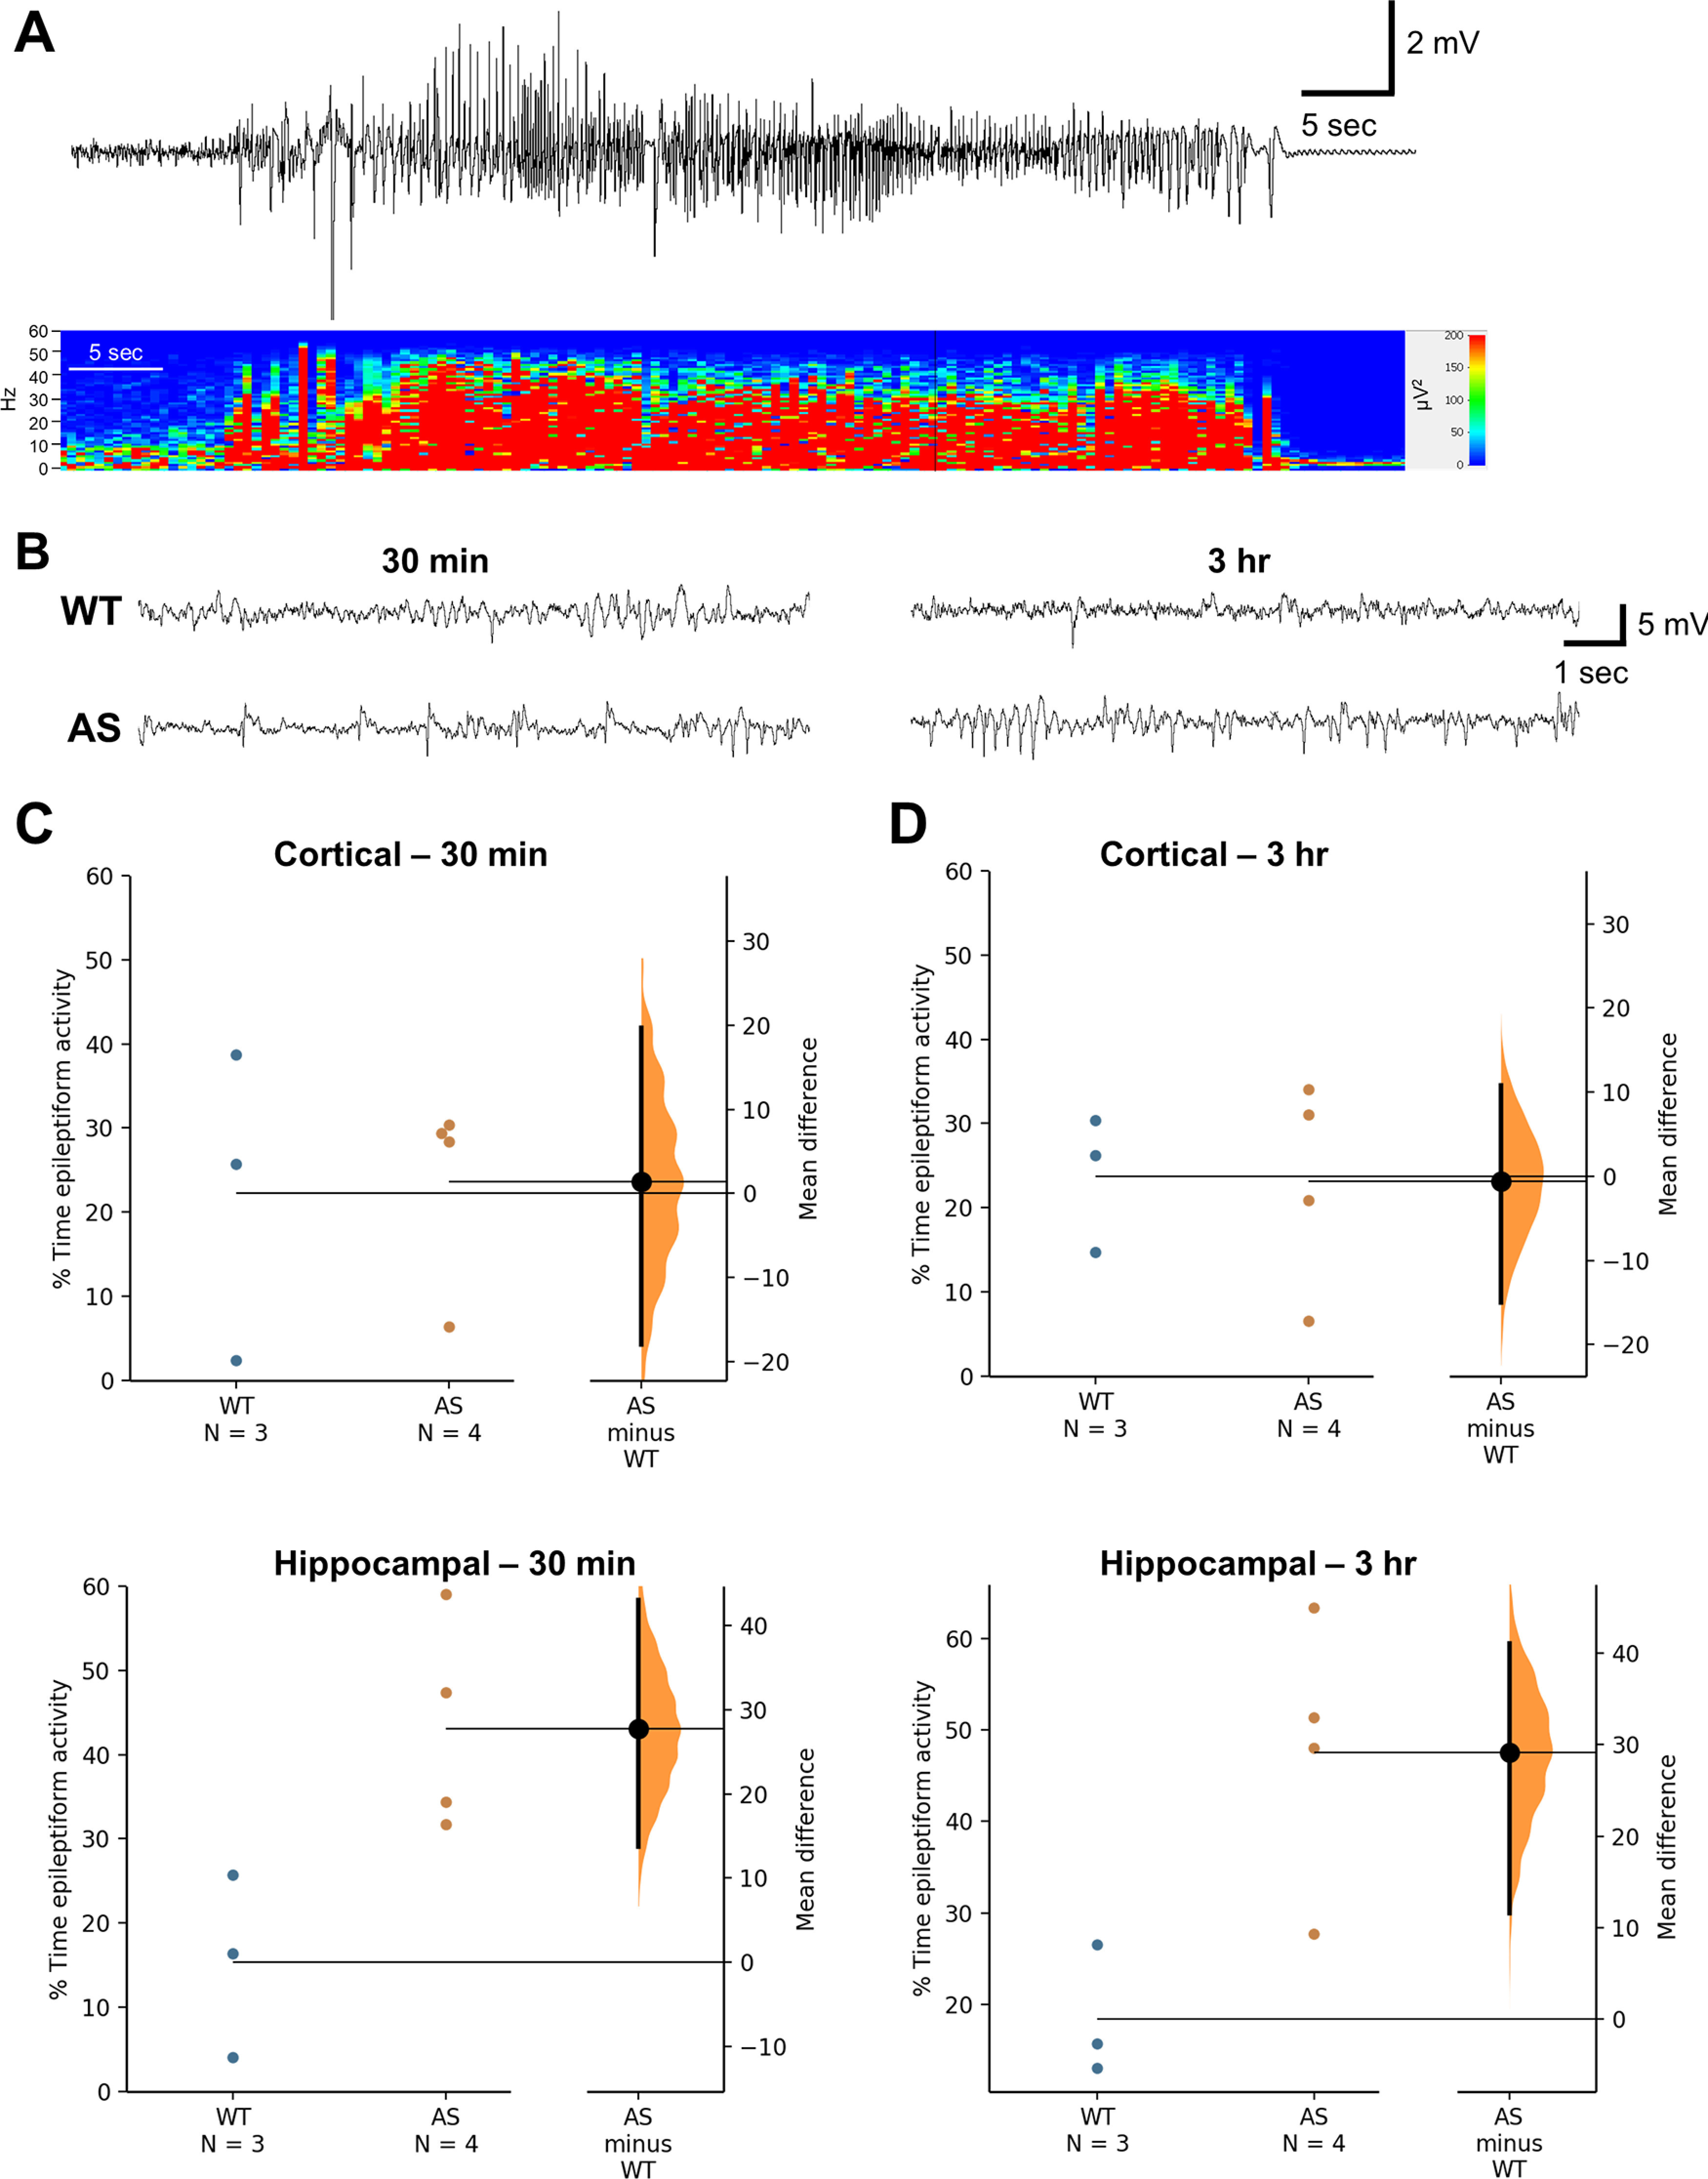
Increased epileptiform activity following a PTZ-induced seizure in adult AS compared with WT rats. A, Representative hippocampal EEG activity and power spectrum of a PTZ-induced single seizure event. B, Representative hippocampal EEG activity in WT and AS rats at 30 min and 3 h following seizure induction. C, AS rats show an increased percent time spent in hippocampal epileptiform activity at 30 min and (D) 3 h post-PTZ (n = 3–4; p < 0.05).