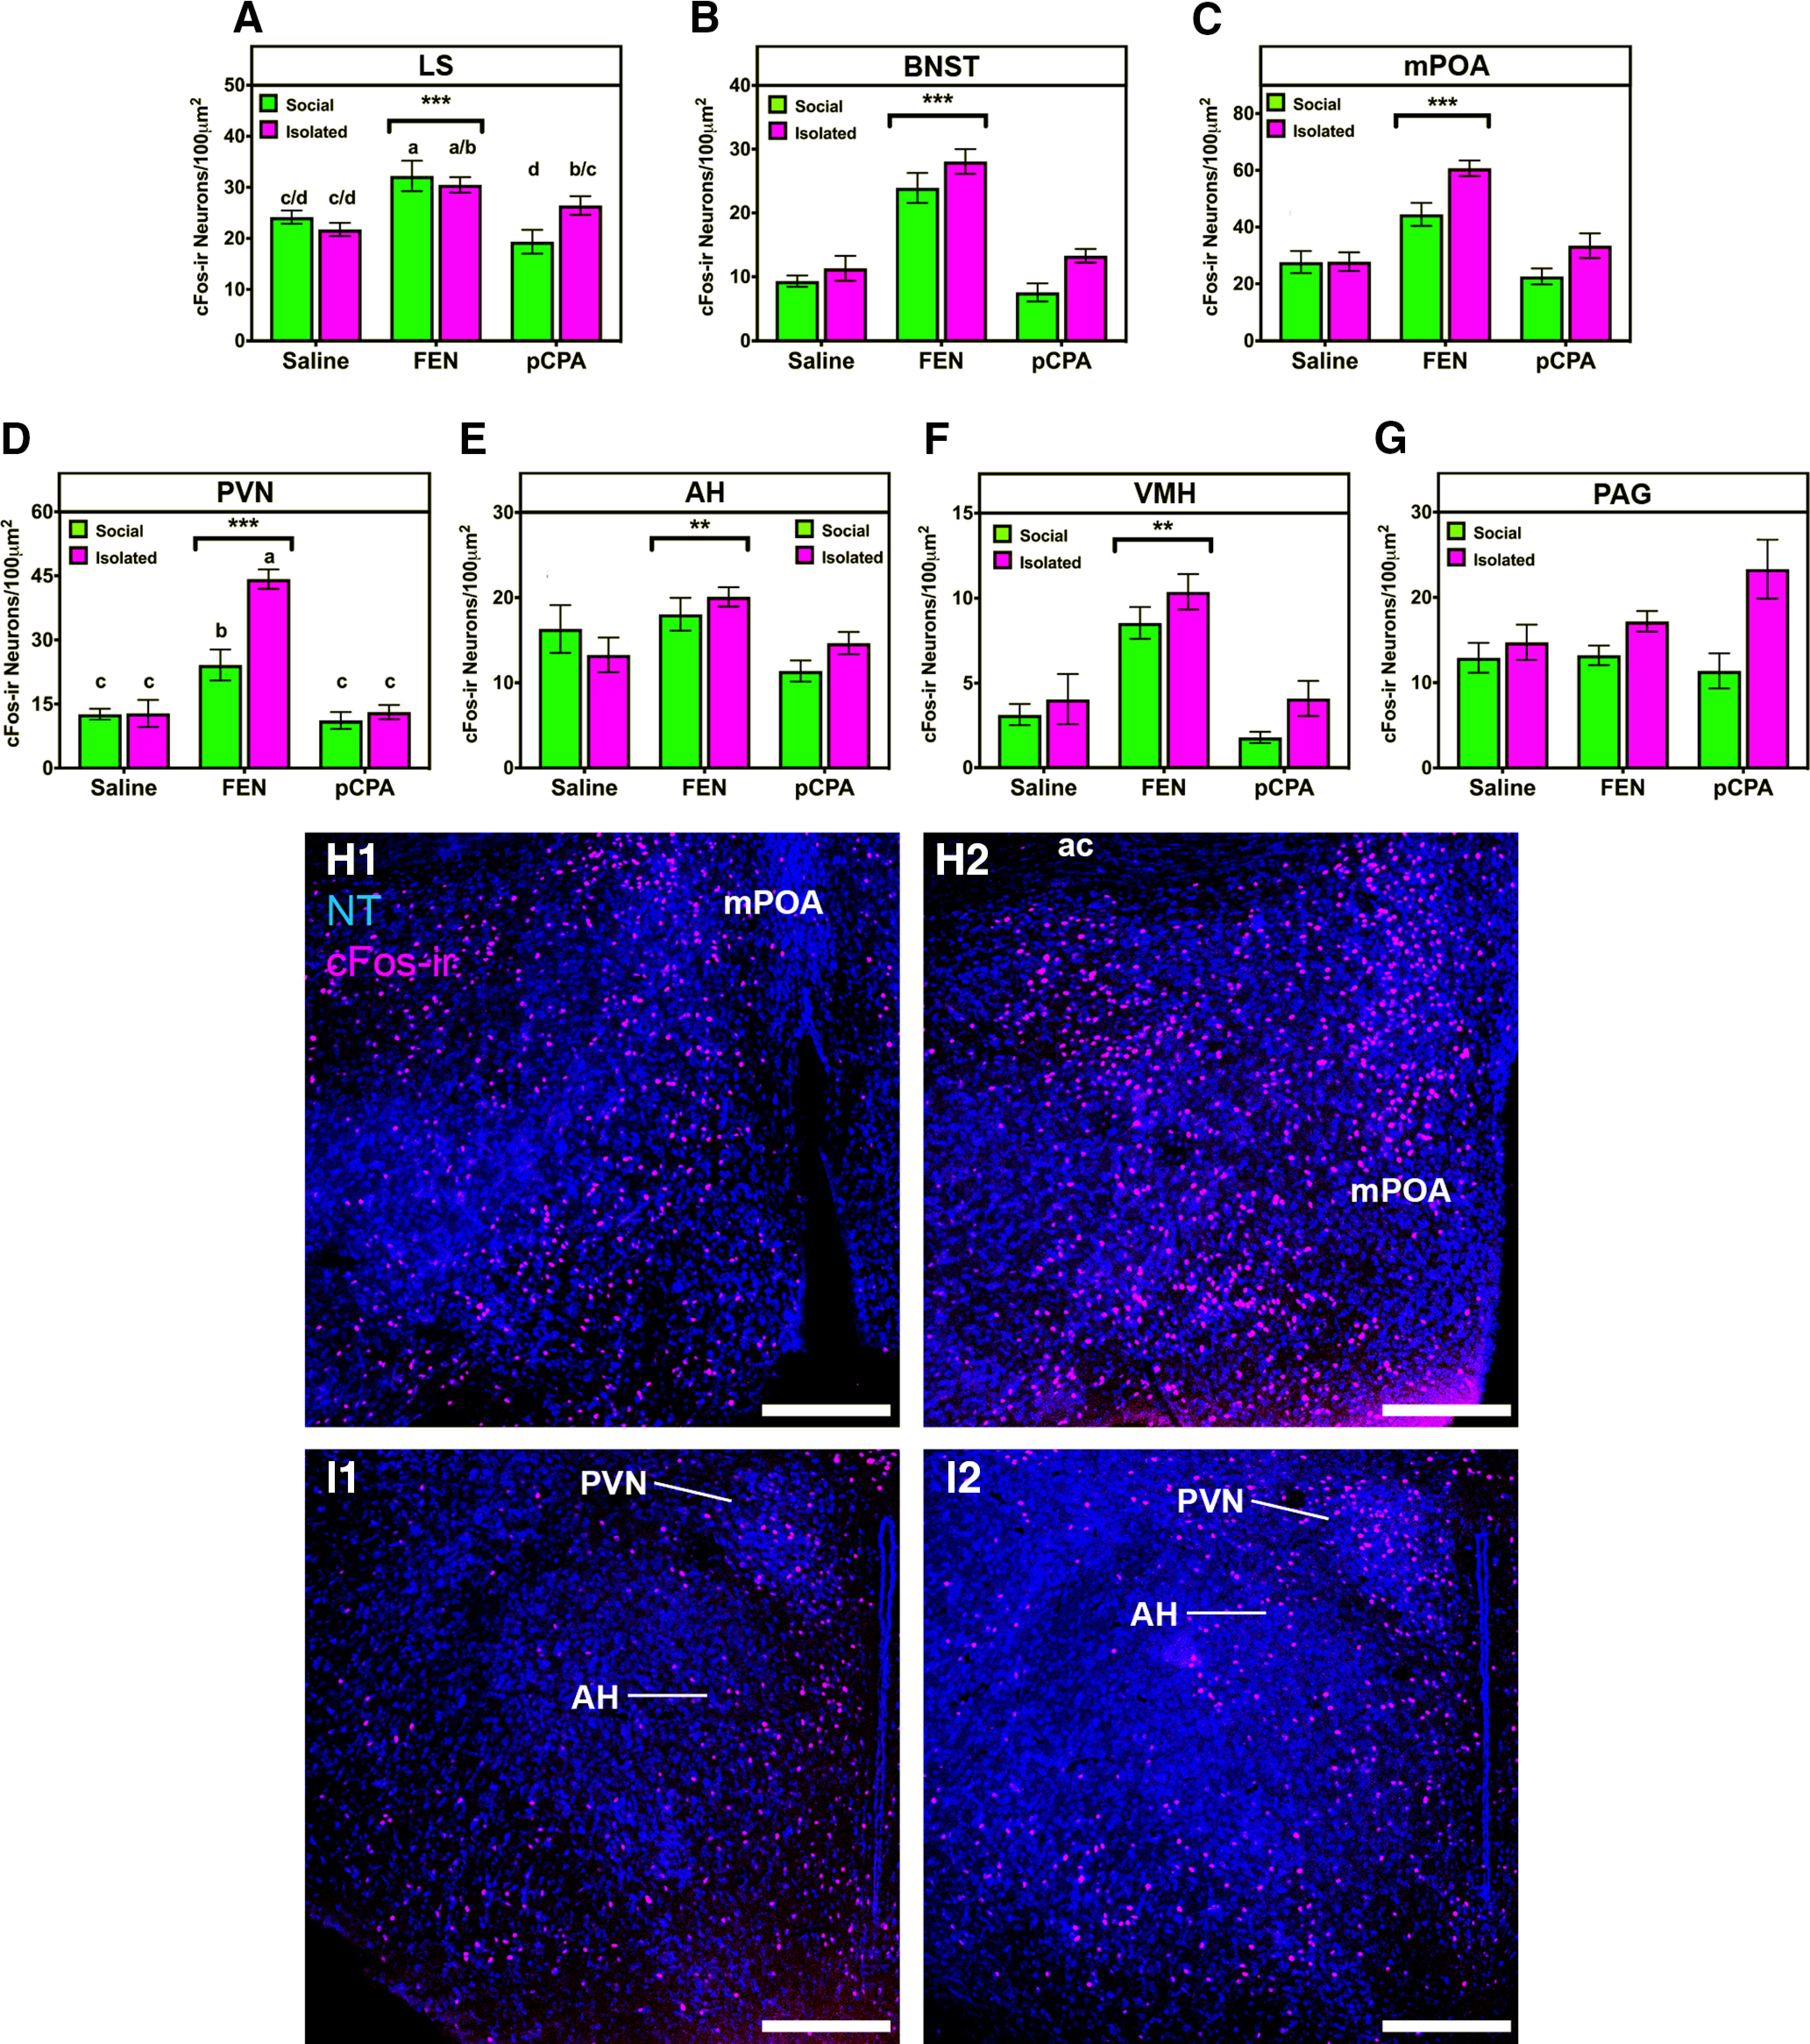
Figure 2.

Summary linear mixed model analysis of cFos-ir within nodes of the SBN. A–G, All data are represented as arithmetic mean ± SEM between socially housed mice (green) and socially isolated mice (magenta). Asterisks represent main effects of drug treatment, **p < 0.001, ***p < 0.0001. Letters indicate post hoc differences (independent t test, p values corrected for multiple comparisons) in the case of housing by drug interaction. H, I, Representative photomicrographs in mPOA (H) and PVN (I) showing the effects of FEN on cFos-ir in socially reared (H1/I1) or socially isolated (H2/I2) mice. NT, blue; cFos-ir, magenta. Scale bar: 250 μm. Please see Extended Data Figure 2-1 for a complete summary of post hoc analyses for linear mixed models performed within each SBN region.
