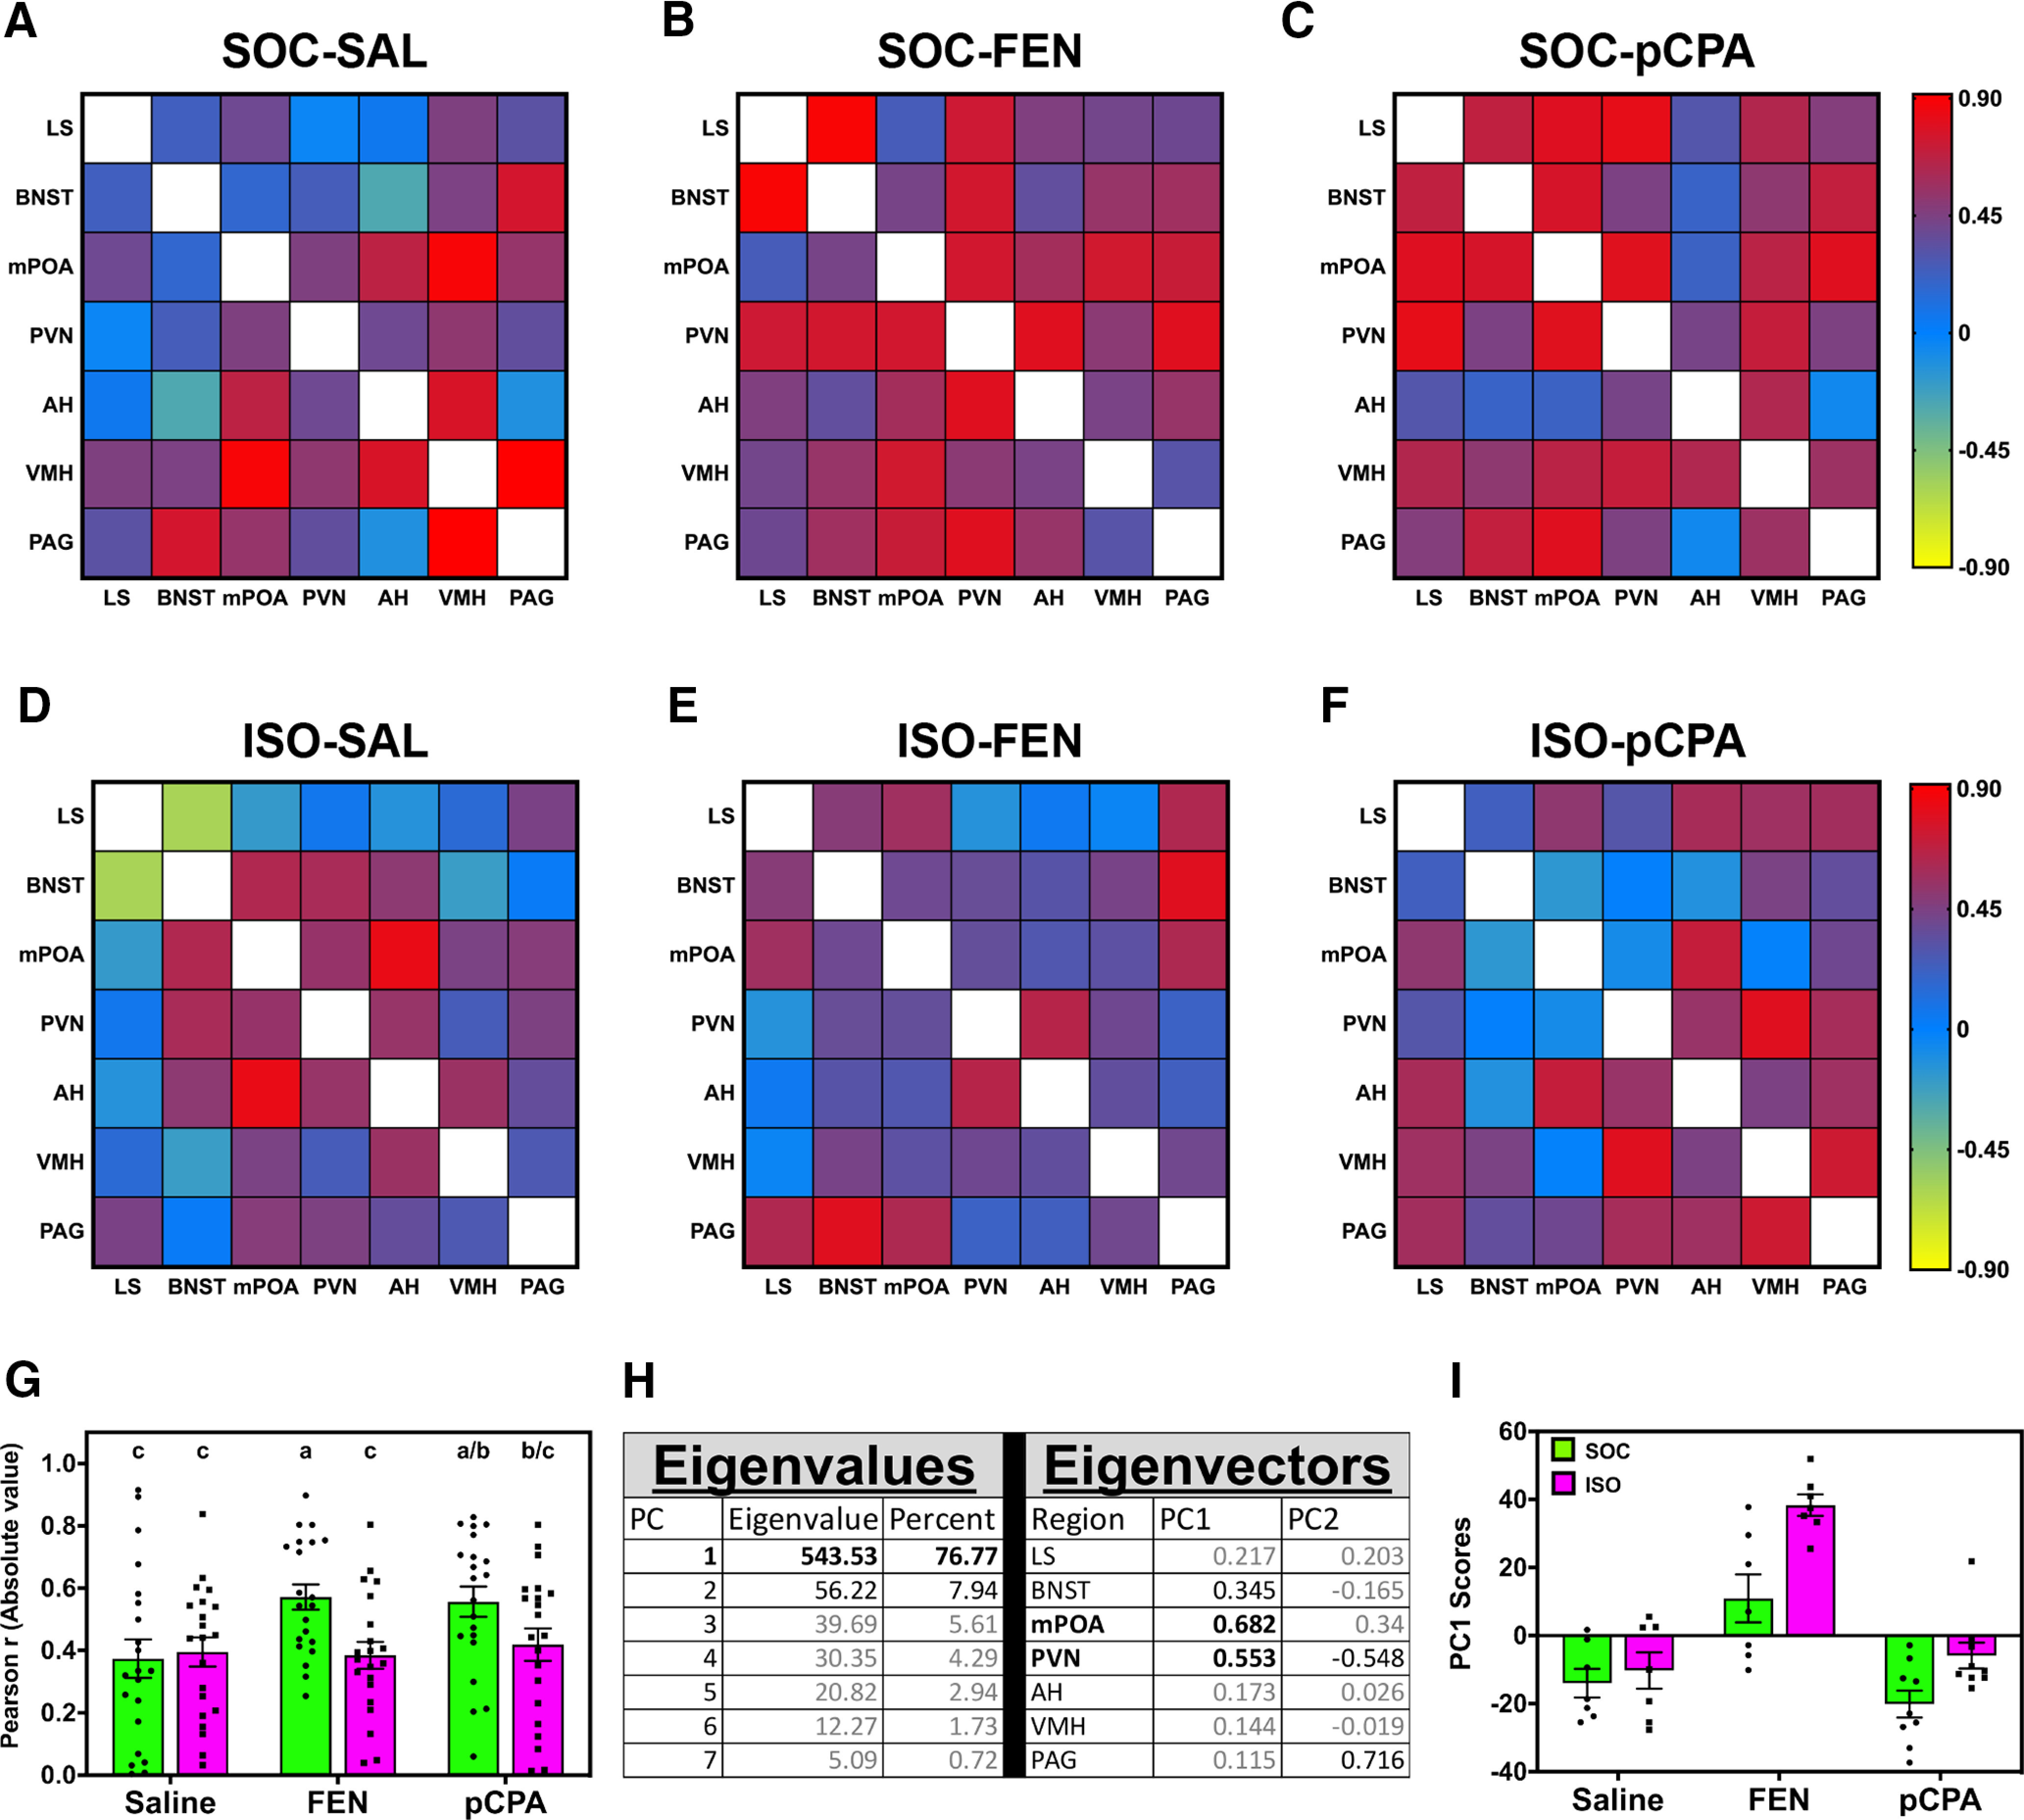
Figure 3.

Correlated patterns of cFos-ir are dependent on social experience. A–F, Heatmap matrices represent pairwise correlations between cFos-ir neurons with SBN nodes (boxes); colors indicate Pearson correlation coefficients. White boxes are self-correlations (r = 1); data are mirrored above and below the diagonal. G, Comparison between the absolute value of Pearson correlation coefficients between groups. Data are represented as mean ± SEM; letters indicate post hoc differences (independent t test, p values corrected for multiple comparisons). H, Results of PCA on covariation matrix derived from A–F. I, Distribution of PC1 scores between groups; data are represented as mean ± SEM. Please see Extended Data Figure 3-1 for a complete summary of pairwise correlation statistics.
