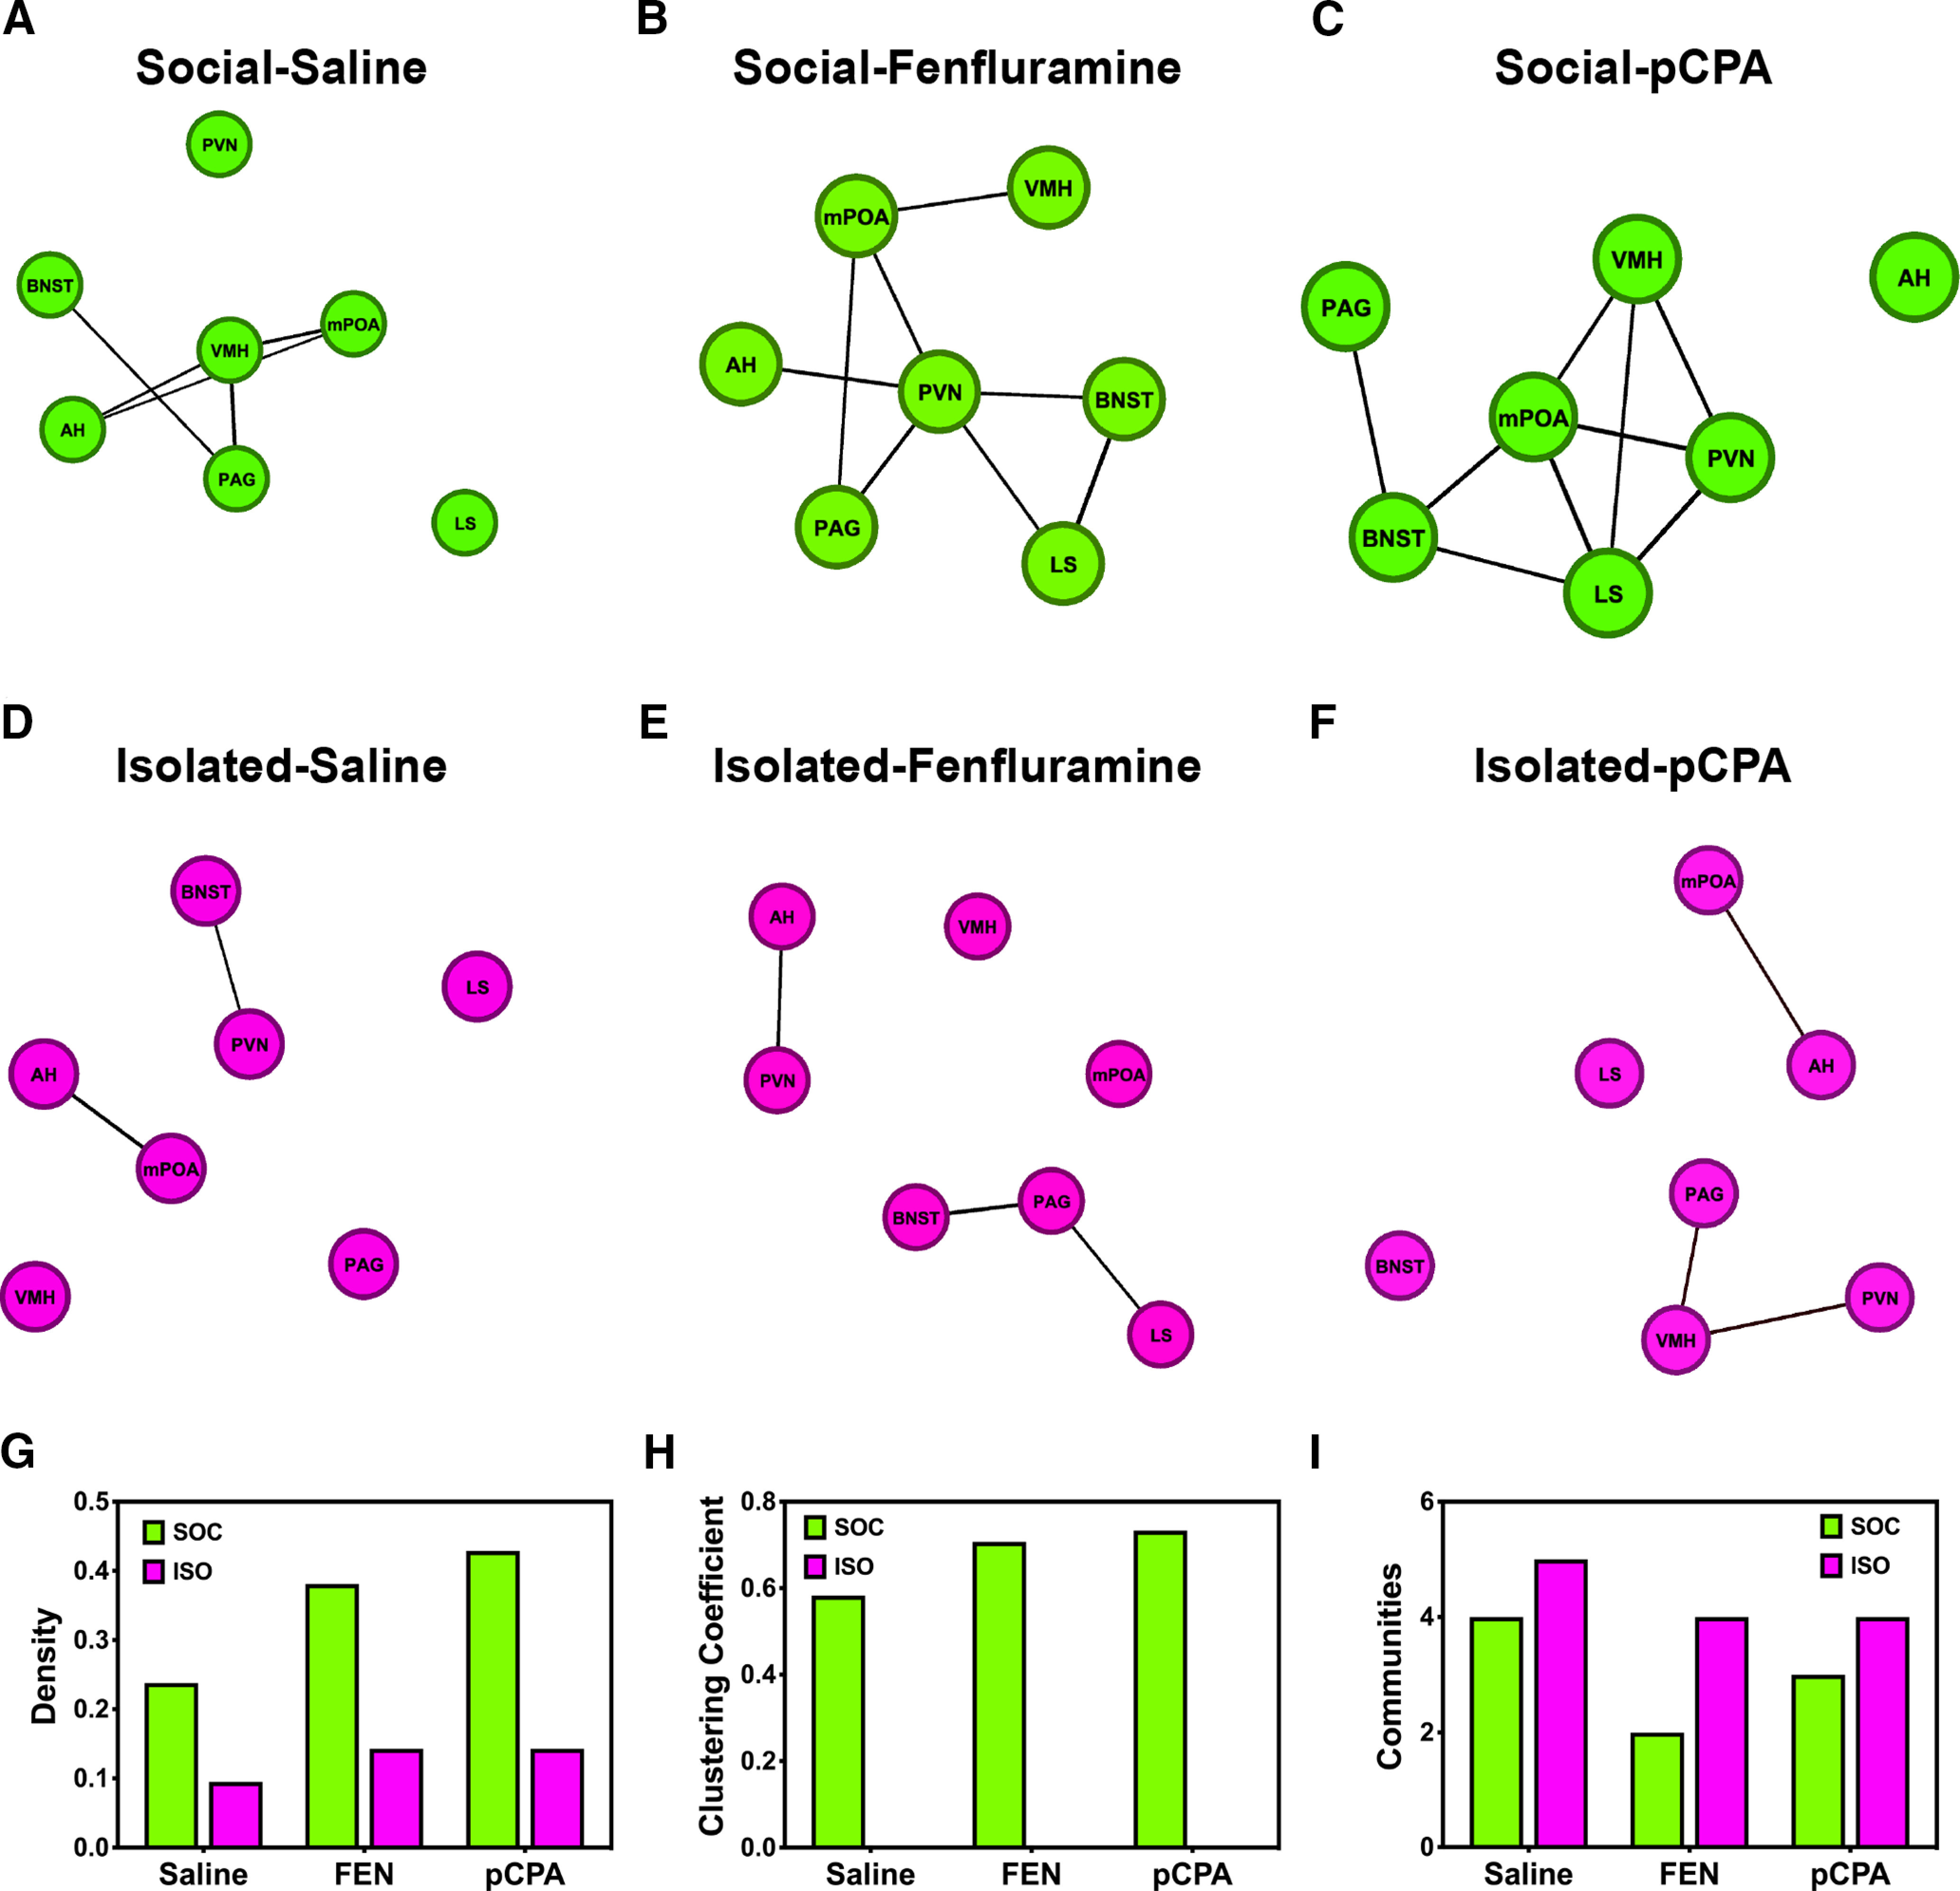
Figure 4.

Correlated patterns of activity form different functional networks between treatment groups. A–F, Individual nodes are represented as green (SOC) or magenta (ISO) circles. The spatial distribution of nodes is determined by their individual strengths of correlation (Jacomy et al., 2014). Lines (edges) connecting nodes are indicative of statistically significant Pearson r values (p < 0.05); non-significant edges (p > 0.05) are excluded from graphs. G–I, Network measures vary between SOC and ISO mice. G, SOC mice (green) have denser functional networks than ISO mice (magenta). H, SOC mice have higher clustering coefficients than ISO mice, whose clustering coefficient is zero in each drug treatment group. I, SOC mice formed fewer thus more densely populated functional communities than ISO mice.
