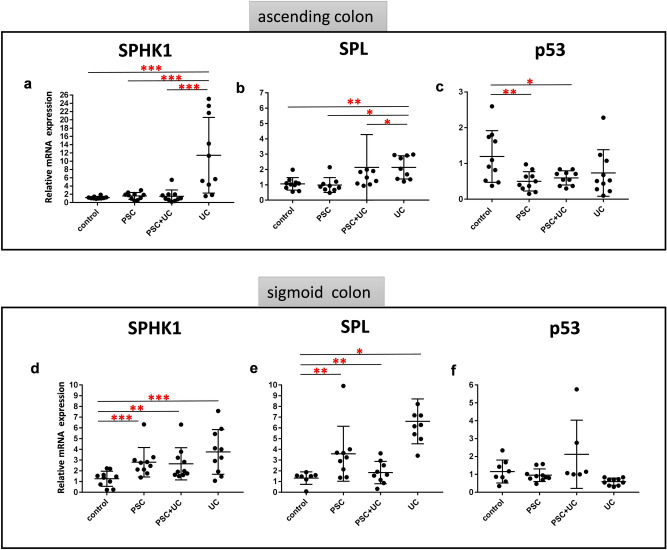
Figure 3.
Expression of genes involved in metabolism of sphingosine and p53 in large intestines of the patients. Relative expression levels of sphingosine-kinase-1 (SPHK1) (a,d), sphingosine-1-phosphate lyase (SPL) (b,e) and p53 (c,f) mRNA in ascending (a–c) and sigmoid colons (d–f) of controls (n = 10), PSC (n = 10), PSC + UC (n = 10), and UC (n = 10). The expression of all genes are normalized to an endogenous reference 18S rRNA and presented as a relative fold change to controls according to the comparative Ct method (2−ΔΔCt). Dots illustrate each patient and lines the mean plus interquartile range (IQR). Statistics: one-way ANOVA followed by Fisher’s PLSD test within the groups; *indicates p-value < 0.05, ** p-value p < 0.01, *** p-value < 0.001 .

